Nepalese vs Trinidadian and Tobagonian Single Mother Households
COMPARE
Nepalese
Trinidadian and Tobagonian
Single Mother Households
Single Mother Households Comparison
Nepalese
Trinidadians and Tobagonians
7.5%
SINGLE MOTHER HOUSEHOLDS
0.1/ 100
METRIC RATING
266th/ 347
METRIC RANK
7.7%
SINGLE MOTHER HOUSEHOLDS
0.0/ 100
METRIC RATING
285th/ 347
METRIC RANK
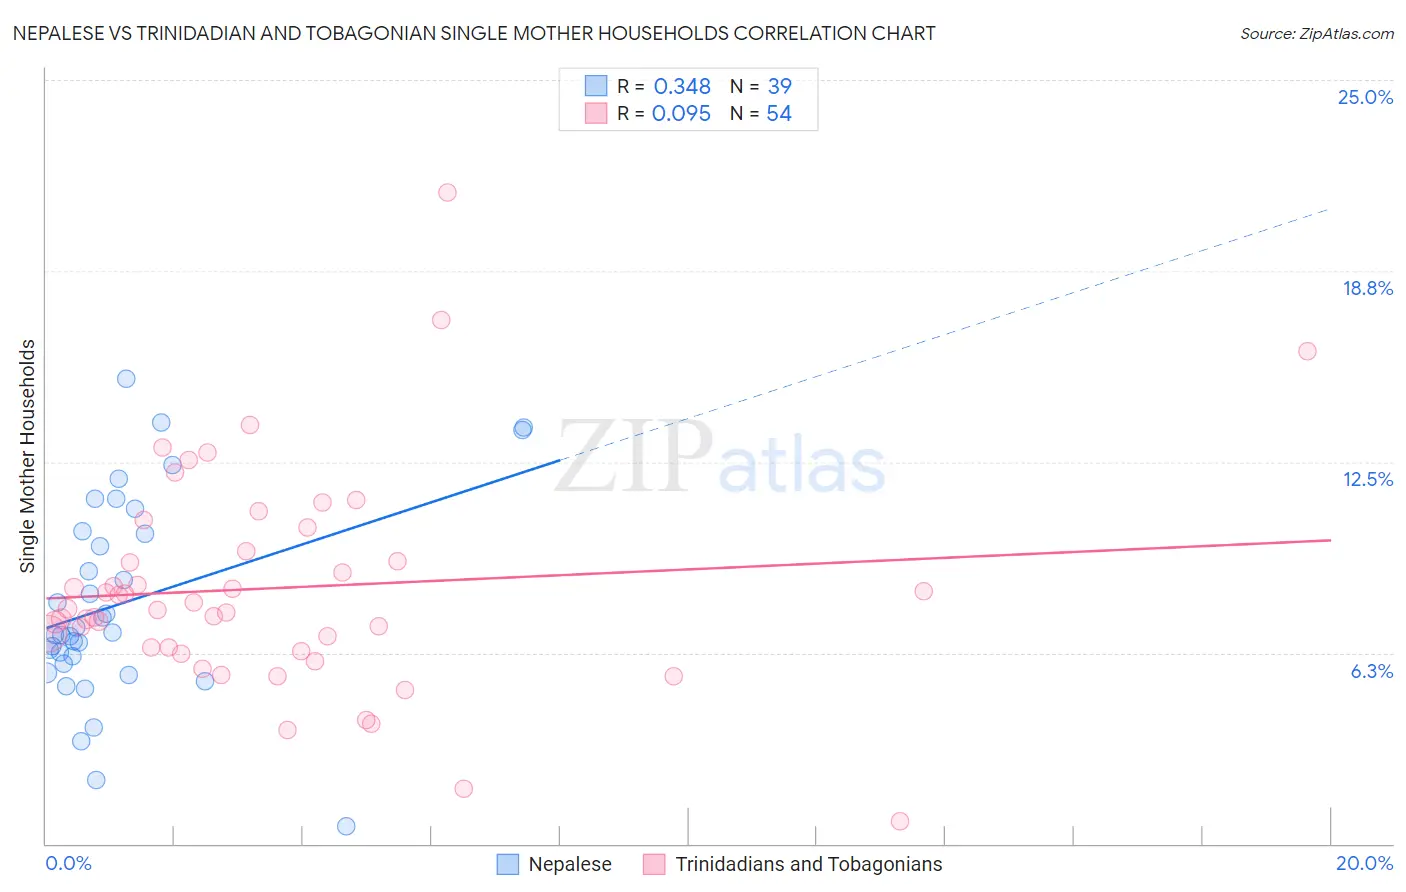
Nepalese vs Trinidadian and Tobagonian Single Mother Households Correlation Chart
The statistical analysis conducted on geographies consisting of 24,517,800 people shows a mild positive correlation between the proportion of Nepalese and percentage of single mother households in the United States with a correlation coefficient (R) of 0.348 and weighted average of 7.5%. Similarly, the statistical analysis conducted on geographies consisting of 219,557,612 people shows a slight positive correlation between the proportion of Trinidadians and Tobagonians and percentage of single mother households in the United States with a correlation coefficient (R) of 0.095 and weighted average of 7.7%, a difference of 3.5%.
Single Mother Households Correlation Summary
| Measurement | Nepalese | Trinidadian and Tobagonian |
| Minimum | 0.56% | 0.73% |
| Maximum | 15.2% | 21.3% |
| Range | 14.7% | 20.6% |
| Mean | 7.9% | 8.4% |
| Median | 6.9% | 7.7% |
| Interquartile 25% (IQ1) | 5.9% | 6.4% |
| Interquartile 75% (IQ3) | 10.2% | 9.6% |
| Interquartile Range (IQR) | 4.3% | 3.2% |
| Standard Deviation (Sample) | 3.3% | 3.6% |
| Standard Deviation (Population) | 3.3% | 3.6% |
Demographics Similar to Nepalese and Trinidadians and Tobagonians by Single Mother Households
In terms of single mother households, the demographic groups most similar to Nepalese are Crow (7.4%, a difference of 0.090%), Blackfeet (7.5%, a difference of 0.34%), Indonesian (7.5%, a difference of 0.38%), Somali (7.5%, a difference of 0.80%), and Immigrants from Cuba (7.5%, a difference of 0.96%). Similarly, the demographic groups most similar to Trinidadians and Tobagonians are Immigrants from Belize (7.7%, a difference of 0.030%), Nigerian (7.7%, a difference of 0.63%), Guatemalan (7.7%, a difference of 0.66%), Immigrants from Sierra Leone (7.7%, a difference of 0.68%), and Immigrants from Laos (7.7%, a difference of 0.68%).
| Demographics | Rating | Rank | Single Mother Households |
| Crow | 0.1 /100 | #265 | Tragic 7.4% |
| Nepalese | 0.1 /100 | #266 | Tragic 7.5% |
| Blackfeet | 0.1 /100 | #267 | Tragic 7.5% |
| Indonesians | 0.1 /100 | #268 | Tragic 7.5% |
| Somalis | 0.1 /100 | #269 | Tragic 7.5% |
| Immigrants | Cuba | 0.1 /100 | #270 | Tragic 7.5% |
| Salvadorans | 0.1 /100 | #271 | Tragic 7.5% |
| Immigrants | Azores | 0.1 /100 | #272 | Tragic 7.5% |
| Belizeans | 0.1 /100 | #273 | Tragic 7.6% |
| Immigrants | Guyana | 0.1 /100 | #274 | Tragic 7.6% |
| Central American Indians | 0.1 /100 | #275 | Tragic 7.6% |
| Guyanese | 0.1 /100 | #276 | Tragic 7.6% |
| Immigrants | Trinidad and Tobago | 0.1 /100 | #277 | Tragic 7.6% |
| Central Americans | 0.1 /100 | #278 | Tragic 7.6% |
| Immigrants | El Salvador | 0.0 /100 | #279 | Tragic 7.6% |
| Immigrants | Sierra Leone | 0.0 /100 | #280 | Tragic 7.7% |
| Immigrants | Laos | 0.0 /100 | #281 | Tragic 7.7% |
| Guatemalans | 0.0 /100 | #282 | Tragic 7.7% |
| Nigerians | 0.0 /100 | #283 | Tragic 7.7% |
| Immigrants | Belize | 0.0 /100 | #284 | Tragic 7.7% |
| Trinidadians and Tobagonians | 0.0 /100 | #285 | Tragic 7.7% |