Nepalese vs Trinidadian and Tobagonian In Labor Force | Age 30-34
COMPARE
Nepalese
Trinidadian and Tobagonian
In Labor Force | Age 30-34
In Labor Force | Age 30-34 Comparison
Nepalese
Trinidadians and Tobagonians
82.7%
IN LABOR FORCE | AGE 30-34
0.0/ 100
METRIC RATING
293rd/ 347
METRIC RANK
84.5%
IN LABOR FORCE | AGE 30-34
18.2/ 100
METRIC RATING
201st/ 347
METRIC RANK
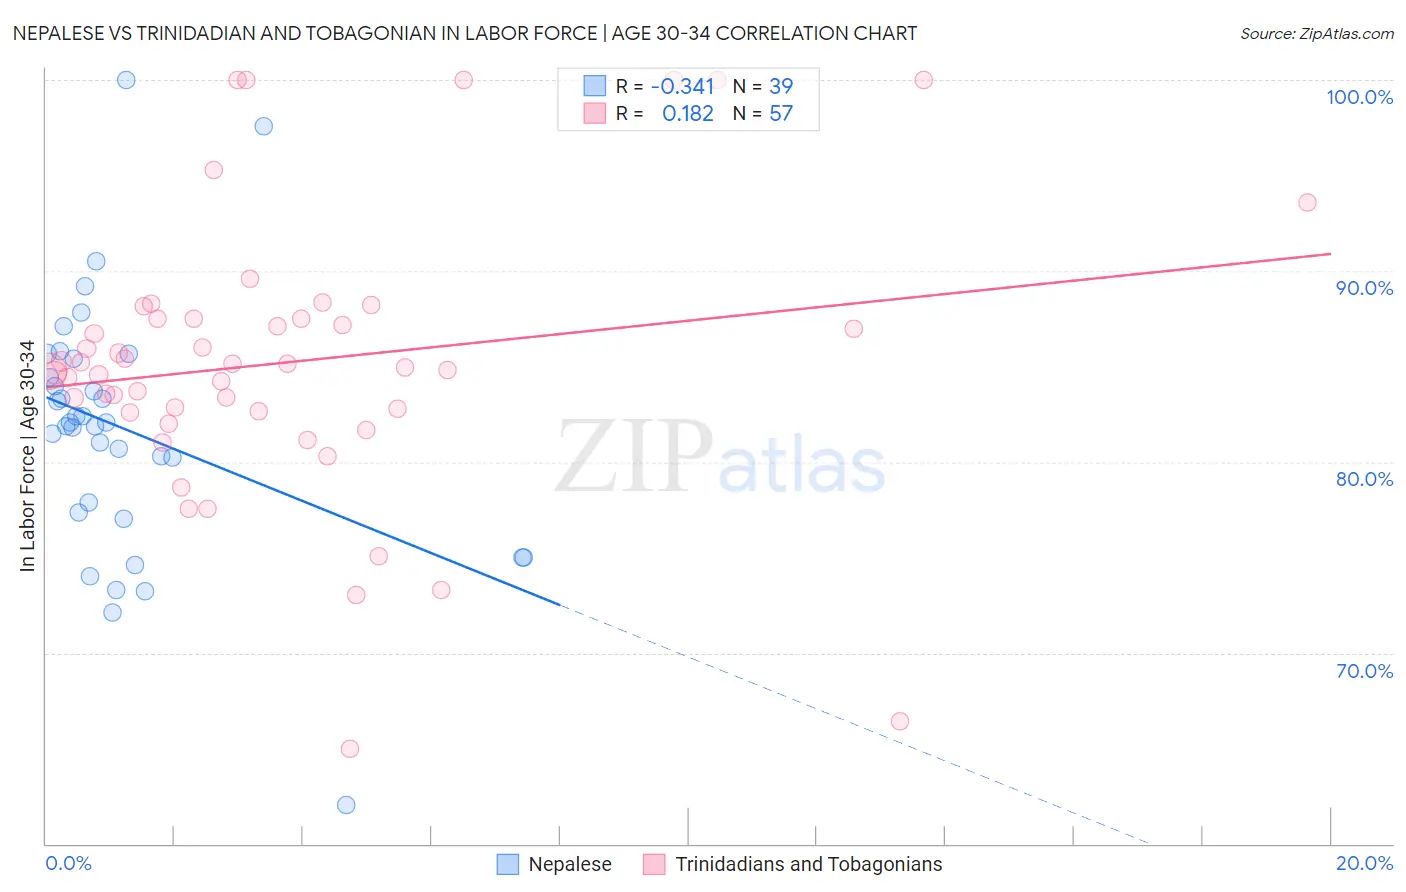
Nepalese vs Trinidadian and Tobagonian In Labor Force | Age 30-34 Correlation Chart
The statistical analysis conducted on geographies consisting of 24,520,458 people shows a mild negative correlation between the proportion of Nepalese and labor force participation rate among population between the ages 30 and 34 in the United States with a correlation coefficient (R) of -0.341 and weighted average of 82.7%. Similarly, the statistical analysis conducted on geographies consisting of 219,758,716 people shows a poor positive correlation between the proportion of Trinidadians and Tobagonians and labor force participation rate among population between the ages 30 and 34 in the United States with a correlation coefficient (R) of 0.182 and weighted average of 84.5%, a difference of 2.1%.
In Labor Force | Age 30-34 Correlation Summary
| Measurement | Nepalese | Trinidadian and Tobagonian |
| Minimum | 62.0% | 65.0% |
| Maximum | 100.0% | 100.0% |
| Range | 38.0% | 35.0% |
| Mean | 81.7% | 85.3% |
| Median | 82.1% | 84.9% |
| Interquartile 25% (IQ1) | 77.3% | 82.6% |
| Interquartile 75% (IQ3) | 85.4% | 87.5% |
| Interquartile Range (IQR) | 8.1% | 4.9% |
| Standard Deviation (Sample) | 6.8% | 7.3% |
| Standard Deviation (Population) | 6.7% | 7.3% |
Similar Demographics by In Labor Force | Age 30-34
Demographics Similar to Nepalese by In Labor Force | Age 30-34
In terms of in labor force | age 30-34, the demographic groups most similar to Nepalese are American (82.7%, a difference of 0.020%), Black/African American (82.8%, a difference of 0.060%), Potawatomi (82.8%, a difference of 0.080%), Blackfeet (82.8%, a difference of 0.11%), and Pennsylvania German (82.6%, a difference of 0.14%).
| Demographics | Rating | Rank | In Labor Force | Age 30-34 |
| Immigrants | Latin America | 0.0 /100 | #286 | Tragic 83.1% |
| Native Hawaiians | 0.0 /100 | #287 | Tragic 83.0% |
| Central American Indians | 0.0 /100 | #288 | Tragic 83.0% |
| Hawaiians | 0.0 /100 | #289 | Tragic 83.0% |
| Blackfeet | 0.0 /100 | #290 | Tragic 82.8% |
| Potawatomi | 0.0 /100 | #291 | Tragic 82.8% |
| Blacks/African Americans | 0.0 /100 | #292 | Tragic 82.8% |
| Nepalese | 0.0 /100 | #293 | Tragic 82.7% |
| Americans | 0.0 /100 | #294 | Tragic 82.7% |
| Pennsylvania Germans | 0.0 /100 | #295 | Tragic 82.6% |
| Chippewa | 0.0 /100 | #296 | Tragic 82.6% |
| Comanche | 0.0 /100 | #297 | Tragic 82.6% |
| Aleuts | 0.0 /100 | #298 | Tragic 82.6% |
| Immigrants | Central America | 0.0 /100 | #299 | Tragic 82.5% |
| Hmong | 0.0 /100 | #300 | Tragic 82.4% |
Demographics Similar to Trinidadians and Tobagonians by In Labor Force | Age 30-34
In terms of in labor force | age 30-34, the demographic groups most similar to Trinidadians and Tobagonians are Immigrants from West Indies (84.5%, a difference of 0.0%), Immigrants from Thailand (84.5%, a difference of 0.010%), Subsaharan African (84.5%, a difference of 0.010%), Dutch (84.5%, a difference of 0.020%), and Canadian (84.4%, a difference of 0.030%).
| Demographics | Rating | Rank | In Labor Force | Age 30-34 |
| Immigrants | Afghanistan | 23.5 /100 | #194 | Fair 84.5% |
| Koreans | 23.2 /100 | #195 | Fair 84.5% |
| British | 22.9 /100 | #196 | Fair 84.5% |
| Immigrants | Syria | 21.9 /100 | #197 | Fair 84.5% |
| Dutch | 20.2 /100 | #198 | Fair 84.5% |
| Immigrants | Thailand | 19.1 /100 | #199 | Poor 84.5% |
| Sub-Saharan Africans | 19.0 /100 | #200 | Poor 84.5% |
| Trinidadians and Tobagonians | 18.2 /100 | #201 | Poor 84.5% |
| Immigrants | West Indies | 18.1 /100 | #202 | Poor 84.5% |
| Canadians | 15.4 /100 | #203 | Poor 84.4% |
| Ecuadorians | 14.2 /100 | #204 | Poor 84.4% |
| French | 13.8 /100 | #205 | Poor 84.4% |
| Lebanese | 10.6 /100 | #206 | Poor 84.4% |
| Bangladeshis | 9.4 /100 | #207 | Tragic 84.3% |
| Arabs | 8.9 /100 | #208 | Tragic 84.3% |