Nepalese vs Immigrants from Nepal Male Poverty
COMPARE
Nepalese
Immigrants from Nepal
Male Poverty
Male Poverty Comparison
Nepalese
Immigrants from Nepal
12.8%
MALE POVERTY
0.3/ 100
METRIC RATING
242nd/ 347
METRIC RANK
11.0%
MALE POVERTY
67.3/ 100
METRIC RATING
152nd/ 347
METRIC RANK
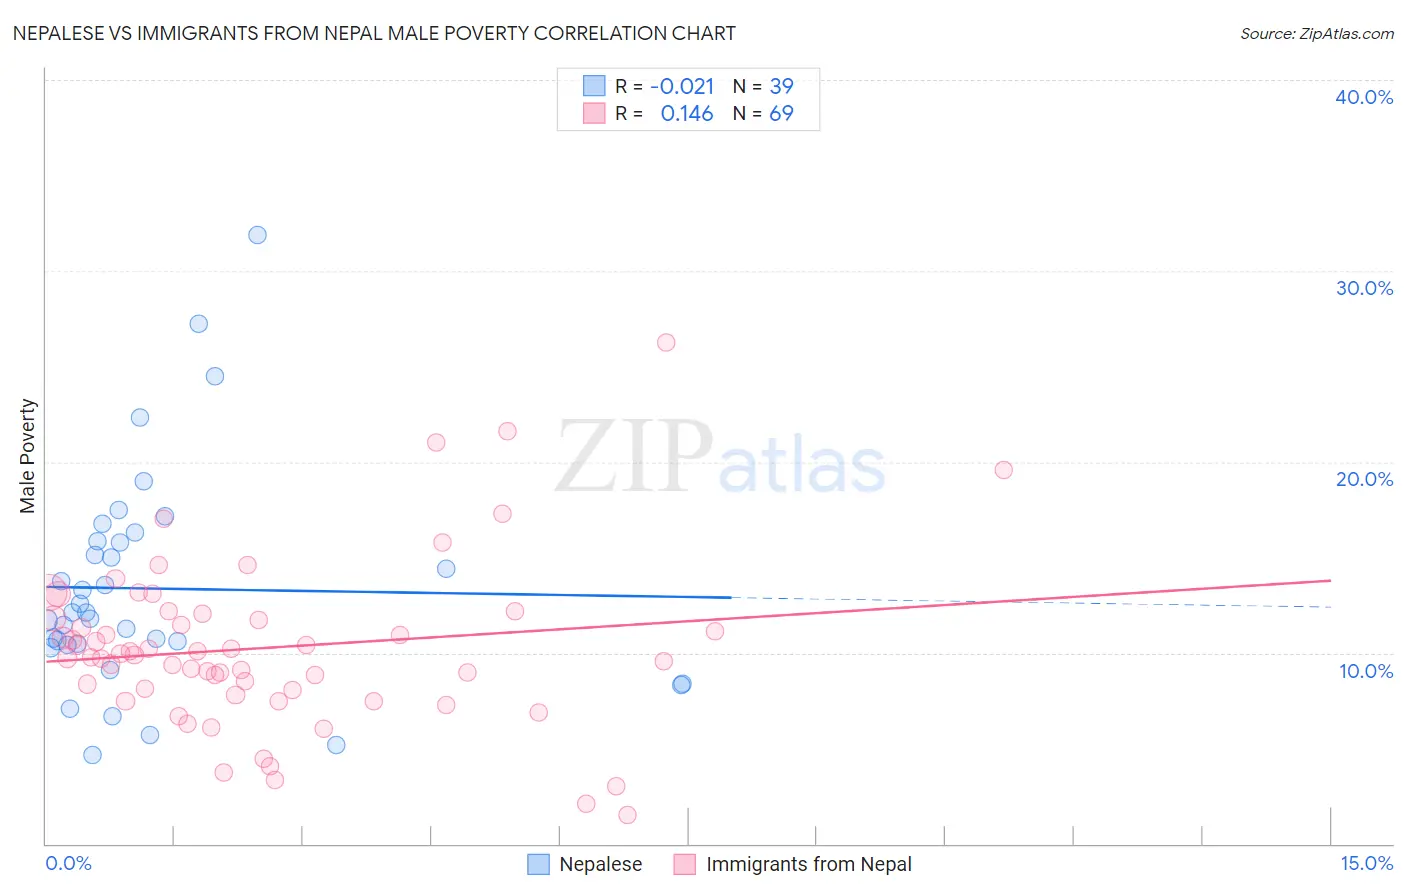
Nepalese vs Immigrants from Nepal Male Poverty Correlation Chart
The statistical analysis conducted on geographies consisting of 24,519,269 people shows no correlation between the proportion of Nepalese and poverty level among males in the United States with a correlation coefficient (R) of -0.021 and weighted average of 12.8%. Similarly, the statistical analysis conducted on geographies consisting of 186,636,323 people shows a poor positive correlation between the proportion of Immigrants from Nepal and poverty level among males in the United States with a correlation coefficient (R) of 0.146 and weighted average of 11.0%, a difference of 16.3%.
Male Poverty Correlation Summary
| Measurement | Nepalese | Immigrants from Nepal |
| Minimum | 4.7% | 1.5% |
| Maximum | 31.9% | 26.3% |
| Range | 27.2% | 24.7% |
| Mean | 13.4% | 10.3% |
| Median | 12.1% | 9.9% |
| Interquartile 25% (IQ1) | 10.4% | 7.9% |
| Interquartile 75% (IQ3) | 15.8% | 11.9% |
| Interquartile Range (IQR) | 5.4% | 4.0% |
| Standard Deviation (Sample) | 5.8% | 4.4% |
| Standard Deviation (Population) | 5.7% | 4.4% |
Similar Demographics by Male Poverty
Demographics Similar to Nepalese by Male Poverty
In terms of male poverty, the demographic groups most similar to Nepalese are Alaskan Athabascan (12.8%, a difference of 0.040%), Tsimshian (12.8%, a difference of 0.14%), Liberian (12.8%, a difference of 0.16%), Sudanese (12.8%, a difference of 0.17%), and Immigrants from El Salvador (12.8%, a difference of 0.46%).
| Demographics | Rating | Rank | Male Poverty |
| Immigrants | Laos | 0.5 /100 | #235 | Tragic 12.6% |
| Immigrants | Saudi Arabia | 0.4 /100 | #236 | Tragic 12.7% |
| French American Indians | 0.4 /100 | #237 | Tragic 12.7% |
| Ecuadorians | 0.4 /100 | #238 | Tragic 12.7% |
| Ghanaians | 0.4 /100 | #239 | Tragic 12.7% |
| Immigrants | Middle Africa | 0.4 /100 | #240 | Tragic 12.7% |
| Sudanese | 0.3 /100 | #241 | Tragic 12.8% |
| Nepalese | 0.3 /100 | #242 | Tragic 12.8% |
| Alaskan Athabascans | 0.3 /100 | #243 | Tragic 12.8% |
| Tsimshian | 0.3 /100 | #244 | Tragic 12.8% |
| Liberians | 0.3 /100 | #245 | Tragic 12.8% |
| Immigrants | El Salvador | 0.2 /100 | #246 | Tragic 12.8% |
| Immigrants | Western Africa | 0.2 /100 | #247 | Tragic 12.9% |
| Immigrants | Sudan | 0.2 /100 | #248 | Tragic 12.9% |
| Potawatomi | 0.2 /100 | #249 | Tragic 12.9% |
Demographics Similar to Immigrants from Nepal by Male Poverty
In terms of male poverty, the demographic groups most similar to Immigrants from Nepal are Venezuelan (11.0%, a difference of 0.0%), Guamanian/Chamorro (11.0%, a difference of 0.030%), Immigrants from Venezuela (11.0%, a difference of 0.070%), Armenian (11.0%, a difference of 0.080%), and Icelander (11.0%, a difference of 0.14%).
| Demographics | Rating | Rank | Male Poverty |
| Immigrants | Germany | 71.6 /100 | #145 | Good 10.9% |
| Syrians | 71.4 /100 | #146 | Good 10.9% |
| Icelanders | 68.5 /100 | #147 | Good 11.0% |
| Armenians | 68.0 /100 | #148 | Good 11.0% |
| Immigrants | Venezuela | 67.9 /100 | #149 | Good 11.0% |
| Guamanians/Chamorros | 67.6 /100 | #150 | Good 11.0% |
| Venezuelans | 67.4 /100 | #151 | Good 11.0% |
| Immigrants | Nepal | 67.3 /100 | #152 | Good 11.0% |
| Immigrants | Bosnia and Herzegovina | 65.2 /100 | #153 | Good 11.0% |
| Immigrants | Kazakhstan | 64.8 /100 | #154 | Good 11.0% |
| Immigrants | Malaysia | 64.7 /100 | #155 | Good 11.0% |
| Costa Ricans | 63.9 /100 | #156 | Good 11.0% |
| Scotch-Irish | 63.7 /100 | #157 | Good 11.0% |
| Colombians | 63.0 /100 | #158 | Good 11.0% |
| Taiwanese | 62.7 /100 | #159 | Good 11.0% |