Nepalese vs Ukrainian Single Female Poverty
COMPARE
Nepalese
Ukrainian
Single Female Poverty
Single Female Poverty Comparison
Nepalese
Ukrainians
21.7%
SINGLE FEMALE POVERTY
9.7/ 100
METRIC RATING
218th/ 347
METRIC RANK
19.8%
SINGLE FEMALE POVERTY
97.6/ 100
METRIC RATING
100th/ 347
METRIC RANK
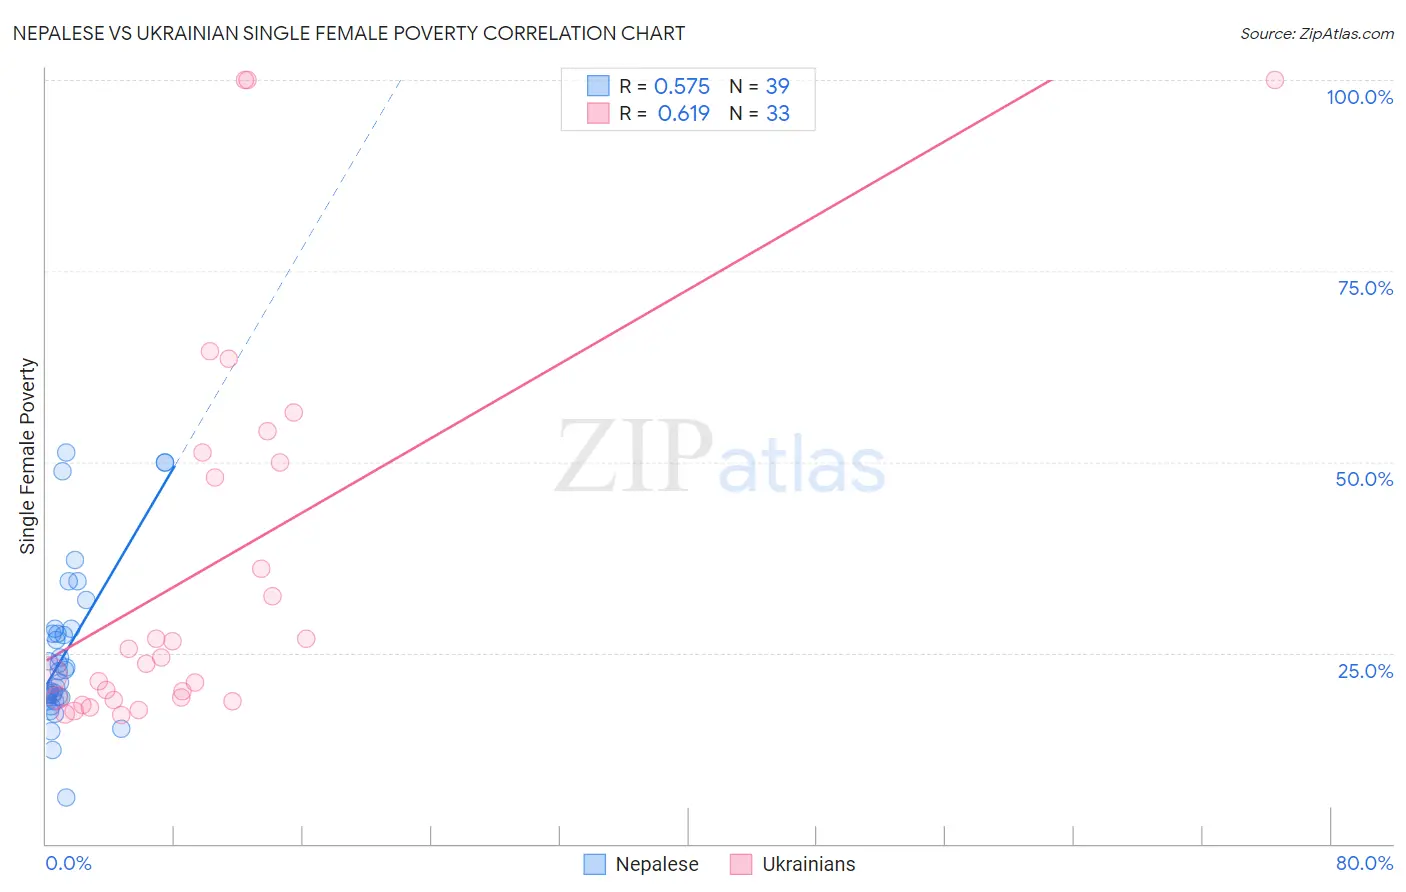
Nepalese vs Ukrainian Single Female Poverty Correlation Chart
The statistical analysis conducted on geographies consisting of 24,501,098 people shows a substantial positive correlation between the proportion of Nepalese and poverty level among single females in the United States with a correlation coefficient (R) of 0.575 and weighted average of 21.7%. Similarly, the statistical analysis conducted on geographies consisting of 437,822,135 people shows a significant positive correlation between the proportion of Ukrainians and poverty level among single females in the United States with a correlation coefficient (R) of 0.619 and weighted average of 19.8%, a difference of 9.8%.
Single Female Poverty Correlation Summary
| Measurement | Nepalese | Ukrainian |
| Minimum | 6.1% | 16.8% |
| Maximum | 51.2% | 100.0% |
| Range | 45.1% | 83.2% |
| Mean | 25.1% | 36.2% |
| Median | 22.6% | 24.4% |
| Interquartile 25% (IQ1) | 19.1% | 19.0% |
| Interquartile 75% (IQ3) | 28.1% | 50.6% |
| Interquartile Range (IQR) | 9.0% | 31.6% |
| Standard Deviation (Sample) | 10.5% | 25.1% |
| Standard Deviation (Population) | 10.4% | 24.8% |
Similar Demographics by Single Female Poverty
Demographics Similar to Nepalese by Single Female Poverty
In terms of single female poverty, the demographic groups most similar to Nepalese are Panamanian (21.7%, a difference of 0.050%), German (21.8%, a difference of 0.26%), Immigrants from Grenada (21.8%, a difference of 0.31%), Immigrants from St. Vincent and the Grenadines (21.7%, a difference of 0.32%), and Immigrants from Eritrea (21.8%, a difference of 0.33%).
| Demographics | Rating | Rank | Single Female Poverty |
| Icelanders | 14.0 /100 | #211 | Poor 21.6% |
| Jamaicans | 14.0 /100 | #212 | Poor 21.6% |
| Guamanians/Chamorros | 13.7 /100 | #213 | Poor 21.6% |
| Immigrants | Nicaragua | 13.3 /100 | #214 | Poor 21.6% |
| Ecuadorians | 12.3 /100 | #215 | Poor 21.6% |
| Immigrants | Barbados | 12.2 /100 | #216 | Poor 21.7% |
| Immigrants | St. Vincent and the Grenadines | 11.7 /100 | #217 | Poor 21.7% |
| Nepalese | 9.7 /100 | #218 | Tragic 21.7% |
| Panamanians | 9.4 /100 | #219 | Tragic 21.7% |
| Germans | 8.3 /100 | #220 | Tragic 21.8% |
| Immigrants | Grenada | 8.0 /100 | #221 | Tragic 21.8% |
| Immigrants | Eritrea | 7.9 /100 | #222 | Tragic 21.8% |
| Scottish | 7.3 /100 | #223 | Tragic 21.8% |
| Barbadians | 7.2 /100 | #224 | Tragic 21.8% |
| English | 6.4 /100 | #225 | Tragic 21.9% |
Demographics Similar to Ukrainians by Single Female Poverty
In terms of single female poverty, the demographic groups most similar to Ukrainians are Immigrants from Belgium (19.8%, a difference of 0.18%), Immigrants from Cameroon (19.8%, a difference of 0.19%), Sierra Leonean (19.7%, a difference of 0.25%), Immigrants from France (19.7%, a difference of 0.26%), and Immigrants from Southern Europe (19.9%, a difference of 0.31%).
| Demographics | Rating | Rank | Single Female Poverty |
| Immigrants | Austria | 98.8 /100 | #93 | Exceptional 19.6% |
| Romanians | 98.6 /100 | #94 | Exceptional 19.6% |
| Estonians | 98.2 /100 | #95 | Exceptional 19.7% |
| Immigrants | Brazil | 98.2 /100 | #96 | Exceptional 19.7% |
| Croatians | 98.1 /100 | #97 | Exceptional 19.7% |
| Immigrants | France | 97.9 /100 | #98 | Exceptional 19.7% |
| Sierra Leoneans | 97.9 /100 | #99 | Exceptional 19.7% |
| Ukrainians | 97.6 /100 | #100 | Exceptional 19.8% |
| Immigrants | Belgium | 97.3 /100 | #101 | Exceptional 19.8% |
| Immigrants | Cameroon | 97.3 /100 | #102 | Exceptional 19.8% |
| Immigrants | Southern Europe | 97.1 /100 | #103 | Exceptional 19.9% |
| Chileans | 96.9 /100 | #104 | Exceptional 19.9% |
| Israelis | 96.9 /100 | #105 | Exceptional 19.9% |
| Ethiopians | 96.7 /100 | #106 | Exceptional 19.9% |
| Immigrants | Syria | 96.7 /100 | #107 | Exceptional 19.9% |