Nepalese vs Swiss Single Female Poverty
COMPARE
Nepalese
Swiss
Single Female Poverty
Single Female Poverty Comparison
Nepalese
Swiss
21.7%
SINGLE FEMALE POVERTY
9.7/ 100
METRIC RATING
218th/ 347
METRIC RANK
21.4%
SINGLE FEMALE POVERTY
24.2/ 100
METRIC RATING
198th/ 347
METRIC RANK
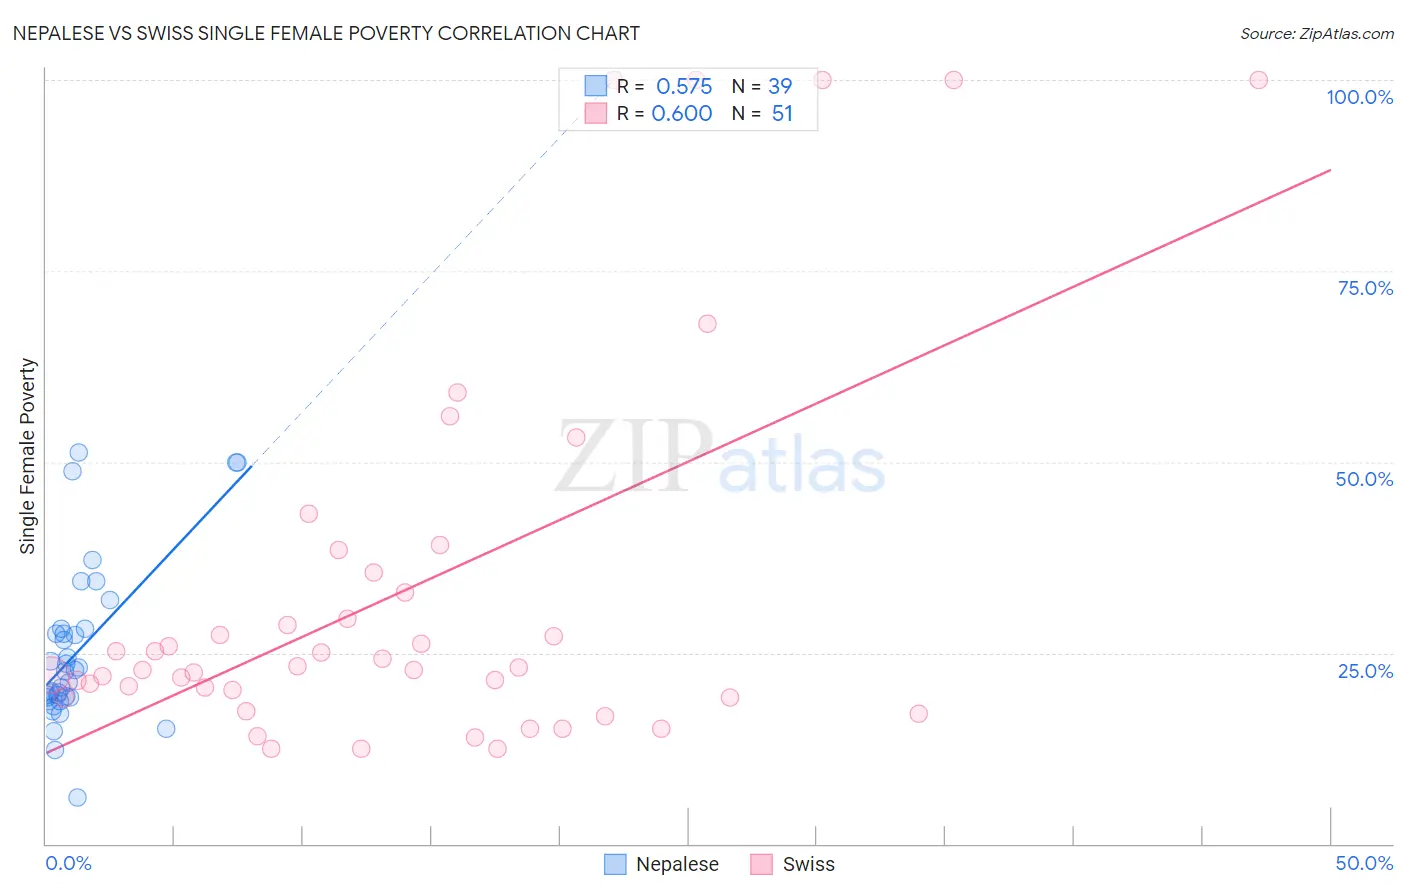
Nepalese vs Swiss Single Female Poverty Correlation Chart
The statistical analysis conducted on geographies consisting of 24,501,098 people shows a substantial positive correlation between the proportion of Nepalese and poverty level among single females in the United States with a correlation coefficient (R) of 0.575 and weighted average of 21.7%. Similarly, the statistical analysis conducted on geographies consisting of 453,637,180 people shows a substantial positive correlation between the proportion of Swiss and poverty level among single females in the United States with a correlation coefficient (R) of 0.600 and weighted average of 21.4%, a difference of 1.7%.
Single Female Poverty Correlation Summary
| Measurement | Nepalese | Swiss |
| Minimum | 6.1% | 12.5% |
| Maximum | 51.2% | 100.0% |
| Range | 45.1% | 87.5% |
| Mean | 25.1% | 33.2% |
| Median | 22.6% | 23.1% |
| Interquartile 25% (IQ1) | 19.1% | 19.2% |
| Interquartile 75% (IQ3) | 28.1% | 35.5% |
| Interquartile Range (IQR) | 9.0% | 16.3% |
| Standard Deviation (Sample) | 10.5% | 25.2% |
| Standard Deviation (Population) | 10.4% | 25.0% |
Demographics Similar to Nepalese and Swiss by Single Female Poverty
In terms of single female poverty, the demographic groups most similar to Nepalese are Immigrants from St. Vincent and the Grenadines (21.7%, a difference of 0.32%), Immigrants from Barbados (21.7%, a difference of 0.39%), Ecuadorian (21.6%, a difference of 0.41%), Immigrants from Nicaragua (21.6%, a difference of 0.54%), and Guamanian/Chamorro (21.6%, a difference of 0.60%). Similarly, the demographic groups most similar to Swiss are Immigrants (21.4%, a difference of 0.19%), Irish (21.4%, a difference of 0.25%), Nigerian (21.4%, a difference of 0.29%), Immigrants from Kenya (21.4%, a difference of 0.31%), and Immigrants from Haiti (21.5%, a difference of 0.49%).
| Demographics | Rating | Rank | Single Female Poverty |
| Swiss | 24.2 /100 | #198 | Fair 21.4% |
| Immigrants | Immigrants | 22.0 /100 | #199 | Fair 21.4% |
| Irish | 21.4 /100 | #200 | Fair 21.4% |
| Nigerians | 20.9 /100 | #201 | Fair 21.4% |
| Immigrants | Kenya | 20.7 /100 | #202 | Fair 21.4% |
| Immigrants | Haiti | 18.8 /100 | #203 | Poor 21.5% |
| Immigrants | Africa | 16.7 /100 | #204 | Poor 21.5% |
| Finns | 16.2 /100 | #205 | Poor 21.5% |
| Belgians | 16.1 /100 | #206 | Poor 21.5% |
| Ghanaians | 15.7 /100 | #207 | Poor 21.6% |
| Haitians | 15.4 /100 | #208 | Poor 21.6% |
| Immigrants | Eastern Africa | 15.1 /100 | #209 | Poor 21.6% |
| Immigrants | Panama | 14.4 /100 | #210 | Poor 21.6% |
| Icelanders | 14.0 /100 | #211 | Poor 21.6% |
| Jamaicans | 14.0 /100 | #212 | Poor 21.6% |
| Guamanians/Chamorros | 13.7 /100 | #213 | Poor 21.6% |
| Immigrants | Nicaragua | 13.3 /100 | #214 | Poor 21.6% |
| Ecuadorians | 12.3 /100 | #215 | Poor 21.6% |
| Immigrants | Barbados | 12.2 /100 | #216 | Poor 21.7% |
| Immigrants | St. Vincent and the Grenadines | 11.7 /100 | #217 | Poor 21.7% |
| Nepalese | 9.7 /100 | #218 | Tragic 21.7% |