Navajo vs Portuguese Single Father Poverty
COMPARE
Navajo
Portuguese
Single Father Poverty
Single Father Poverty Comparison
Navajo
Portuguese
29.2%
SINGLE FATHER POVERTY
0.0/ 100
METRIC RATING
344th/ 347
METRIC RANK
16.2%
SINGLE FATHER POVERTY
62.3/ 100
METRIC RATING
158th/ 347
METRIC RANK
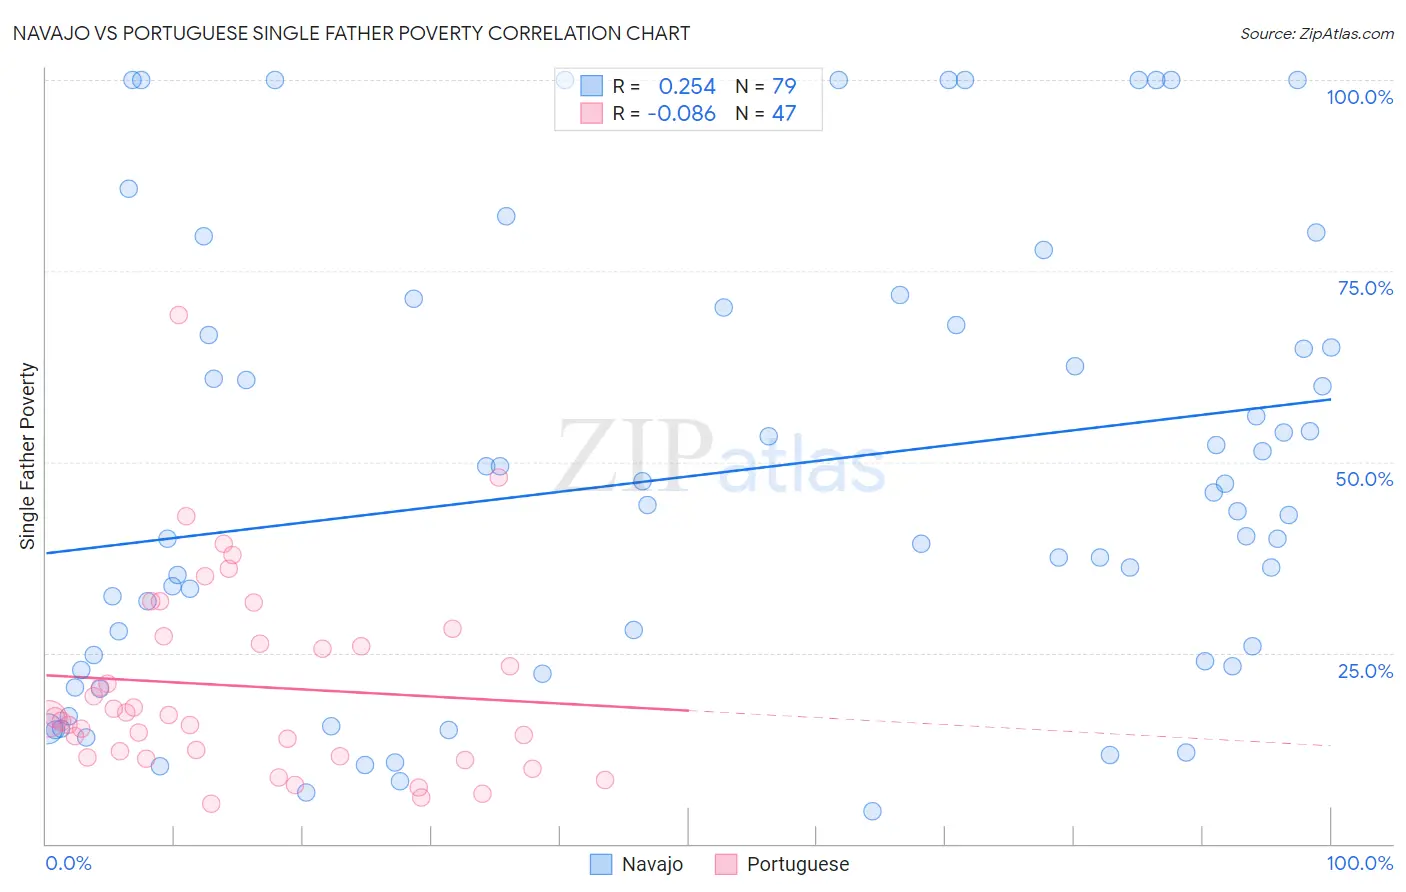
Navajo vs Portuguese Single Father Poverty Correlation Chart
The statistical analysis conducted on geographies consisting of 195,813,521 people shows a weak positive correlation between the proportion of Navajo and poverty level among single fathers in the United States with a correlation coefficient (R) of 0.254 and weighted average of 29.2%. Similarly, the statistical analysis conducted on geographies consisting of 344,973,459 people shows a slight negative correlation between the proportion of Portuguese and poverty level among single fathers in the United States with a correlation coefficient (R) of -0.086 and weighted average of 16.2%, a difference of 80.3%.
Single Father Poverty Correlation Summary
| Measurement | Navajo | Portuguese |
| Minimum | 4.3% | 5.2% |
| Maximum | 100.0% | 69.3% |
| Range | 95.7% | 64.1% |
| Mean | 48.2% | 20.6% |
| Median | 43.6% | 16.6% |
| Interquartile 25% (IQ1) | 23.3% | 11.5% |
| Interquartile 75% (IQ3) | 67.9% | 27.1% |
| Interquartile Range (IQR) | 44.6% | 15.6% |
| Standard Deviation (Sample) | 29.2% | 12.8% |
| Standard Deviation (Population) | 29.0% | 12.6% |
Similar Demographics by Single Father Poverty
Demographics Similar to Navajo by Single Father Poverty
In terms of single father poverty, the demographic groups most similar to Navajo are Lumbee (28.5%, a difference of 2.6%), Yuman (28.4%, a difference of 2.9%), Crow (30.3%, a difference of 3.6%), Hopi (27.2%, a difference of 7.6%), and Puerto Rican (31.5%, a difference of 7.9%).
| Demographics | Rating | Rank | Single Father Poverty |
| Natives/Alaskans | 0.0 /100 | #333 | Tragic 22.4% |
| Kiowa | 0.0 /100 | #334 | Tragic 22.5% |
| Shoshone | 0.0 /100 | #335 | Tragic 22.9% |
| Cajuns | 0.0 /100 | #336 | Tragic 23.1% |
| Sioux | 0.0 /100 | #337 | Tragic 23.9% |
| Arapaho | 0.0 /100 | #338 | Tragic 24.0% |
| Apache | 0.0 /100 | #339 | Tragic 24.2% |
| Houma | 0.0 /100 | #340 | Tragic 26.7% |
| Hopi | 0.0 /100 | #341 | Tragic 27.2% |
| Yuman | 0.0 /100 | #342 | Tragic 28.4% |
| Lumbee | 0.0 /100 | #343 | Tragic 28.5% |
| Navajo | 0.0 /100 | #344 | Tragic 29.2% |
| Crow | 0.0 /100 | #345 | Tragic 30.3% |
| Puerto Ricans | 0.0 /100 | #346 | Tragic 31.5% |
| Yup'ik | 0.0 /100 | #347 | Tragic 32.5% |
Demographics Similar to Portuguese by Single Father Poverty
In terms of single father poverty, the demographic groups most similar to Portuguese are Immigrants from Czechoslovakia (16.2%, a difference of 0.020%), Belizean (16.2%, a difference of 0.11%), Immigrants from Sudan (16.2%, a difference of 0.12%), Immigrants from Jordan (16.2%, a difference of 0.18%), and Estonian (16.2%, a difference of 0.26%).
| Demographics | Rating | Rank | Single Father Poverty |
| Immigrants | France | 73.1 /100 | #151 | Good 16.1% |
| Immigrants | Zimbabwe | 72.1 /100 | #152 | Good 16.1% |
| Immigrants | Israel | 72.0 /100 | #153 | Good 16.1% |
| Mexicans | 70.1 /100 | #154 | Good 16.1% |
| Immigrants | Nicaragua | 67.8 /100 | #155 | Good 16.2% |
| Immigrants | Jordan | 66.0 /100 | #156 | Good 16.2% |
| Immigrants | Czechoslovakia | 62.8 /100 | #157 | Good 16.2% |
| Portuguese | 62.3 /100 | #158 | Good 16.2% |
| Belizeans | 59.9 /100 | #159 | Average 16.2% |
| Immigrants | Sudan | 59.8 /100 | #160 | Average 16.2% |
| Estonians | 56.7 /100 | #161 | Average 16.2% |
| Ugandans | 55.9 /100 | #162 | Average 16.3% |
| Immigrants | Costa Rica | 55.7 /100 | #163 | Average 16.3% |
| Guyanese | 55.2 /100 | #164 | Average 16.3% |
| Immigrants | Bangladesh | 55.1 /100 | #165 | Average 16.3% |