Navajo vs Vietnamese Single Father Households
COMPARE
Navajo
Vietnamese
Single Father Households
Single Father Households Comparison
Navajo
Vietnamese
3.2%
SINGLE FATHER HOUSEHOLDS
0.0/ 100
METRIC RATING
331st/ 347
METRIC RANK
2.0%
SINGLE FATHER HOUSEHOLDS
99.9/ 100
METRIC RATING
61st/ 347
METRIC RANK
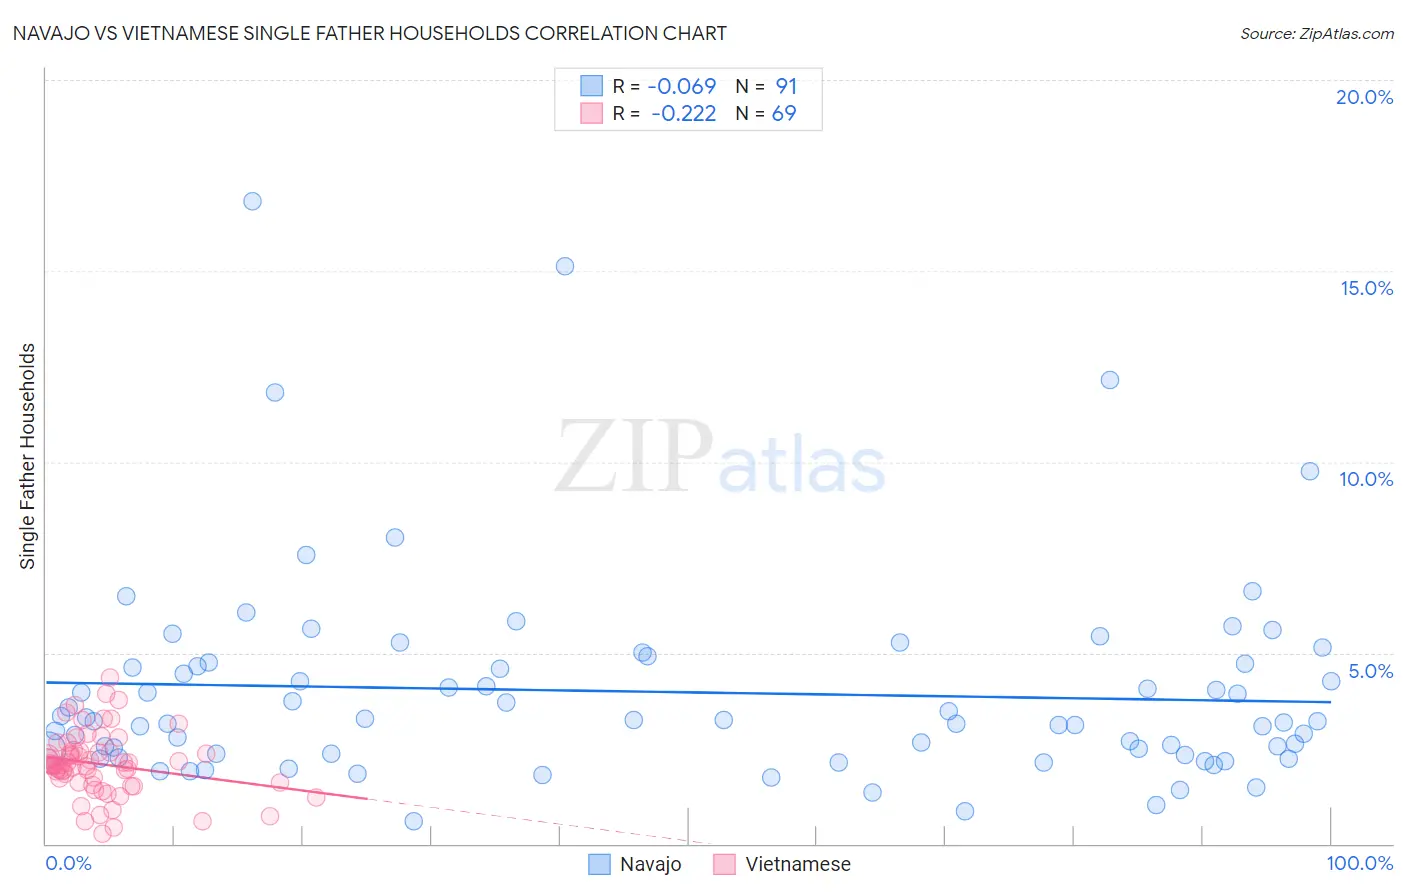
Navajo vs Vietnamese Single Father Households Correlation Chart
The statistical analysis conducted on geographies consisting of 223,786,541 people shows a slight negative correlation between the proportion of Navajo and percentage of single father households in the United States with a correlation coefficient (R) of -0.069 and weighted average of 3.2%. Similarly, the statistical analysis conducted on geographies consisting of 170,091,169 people shows a weak negative correlation between the proportion of Vietnamese and percentage of single father households in the United States with a correlation coefficient (R) of -0.222 and weighted average of 2.0%, a difference of 56.3%.
Single Father Households Correlation Summary
| Measurement | Navajo | Vietnamese |
| Minimum | 0.57% | 0.28% |
| Maximum | 16.8% | 4.4% |
| Range | 16.2% | 4.1% |
| Mean | 4.0% | 2.1% |
| Median | 3.2% | 2.1% |
| Interquartile 25% (IQ1) | 2.4% | 1.6% |
| Interquartile 75% (IQ3) | 4.7% | 2.4% |
| Interquartile Range (IQR) | 2.4% | 0.79% |
| Standard Deviation (Sample) | 2.7% | 0.82% |
| Standard Deviation (Population) | 2.7% | 0.82% |
Similar Demographics by Single Father Households
Demographics Similar to Navajo by Single Father Households
In terms of single father households, the demographic groups most similar to Navajo are Yaqui (3.2%, a difference of 0.040%), Native/Alaskan (3.2%, a difference of 0.54%), Nepalese (3.1%, a difference of 2.3%), Chippewa (3.1%, a difference of 3.2%), and Immigrants from Cabo Verde (3.1%, a difference of 3.3%).
| Demographics | Rating | Rank | Single Father Households |
| Fijians | 0.0 /100 | #324 | Tragic 3.0% |
| Immigrants | Mexico | 0.0 /100 | #325 | Tragic 3.0% |
| Aleuts | 0.0 /100 | #326 | Tragic 3.0% |
| Bangladeshis | 0.0 /100 | #327 | Tragic 3.1% |
| Immigrants | Cabo Verde | 0.0 /100 | #328 | Tragic 3.1% |
| Chippewa | 0.0 /100 | #329 | Tragic 3.1% |
| Nepalese | 0.0 /100 | #330 | Tragic 3.1% |
| Navajo | 0.0 /100 | #331 | Tragic 3.2% |
| Yaqui | 0.0 /100 | #332 | Tragic 3.2% |
| Natives/Alaskans | 0.0 /100 | #333 | Tragic 3.2% |
| Yuman | 0.0 /100 | #334 | Tragic 3.3% |
| Colville | 0.0 /100 | #335 | Tragic 3.3% |
| Paiute | 0.0 /100 | #336 | Tragic 3.3% |
| Pueblo | 0.0 /100 | #337 | Tragic 3.3% |
| Sioux | 0.0 /100 | #338 | Tragic 3.3% |
Demographics Similar to Vietnamese by Single Father Households
In terms of single father households, the demographic groups most similar to Vietnamese are Immigrants from Malaysia (2.0%, a difference of 0.20%), Immigrants from Austria (2.0%, a difference of 0.24%), Immigrants from North Macedonia (2.0%, a difference of 0.25%), Immigrants from Czechoslovakia (2.0%, a difference of 0.35%), and Burmese (2.0%, a difference of 0.38%).
| Demographics | Rating | Rank | Single Father Households |
| Immigrants | Korea | 99.9 /100 | #54 | Exceptional 2.0% |
| Immigrants | France | 99.9 /100 | #55 | Exceptional 2.0% |
| Immigrants | Norway | 99.9 /100 | #56 | Exceptional 2.0% |
| Burmese | 99.9 /100 | #57 | Exceptional 2.0% |
| Immigrants | Czechoslovakia | 99.9 /100 | #58 | Exceptional 2.0% |
| Immigrants | North Macedonia | 99.9 /100 | #59 | Exceptional 2.0% |
| Immigrants | Austria | 99.9 /100 | #60 | Exceptional 2.0% |
| Vietnamese | 99.9 /100 | #61 | Exceptional 2.0% |
| Immigrants | Malaysia | 99.9 /100 | #62 | Exceptional 2.0% |
| Maltese | 99.9 /100 | #63 | Exceptional 2.0% |
| Mongolians | 99.9 /100 | #64 | Exceptional 2.1% |
| Paraguayans | 99.9 /100 | #65 | Exceptional 2.1% |
| Immigrants | Western Asia | 99.8 /100 | #66 | Exceptional 2.1% |
| Immigrants | Italy | 99.8 /100 | #67 | Exceptional 2.1% |
| Immigrants | Denmark | 99.8 /100 | #68 | Exceptional 2.1% |