Navajo vs Immigrants from El Salvador Single Father Poverty
COMPARE
Navajo
Immigrants from El Salvador
Single Father Poverty
Single Father Poverty Comparison
Navajo
Immigrants from El Salvador
29.2%
SINGLE FATHER POVERTY
0.0/ 100
METRIC RATING
344th/ 347
METRIC RANK
15.0%
SINGLE FATHER POVERTY
99.9/ 100
METRIC RATING
52nd/ 347
METRIC RANK
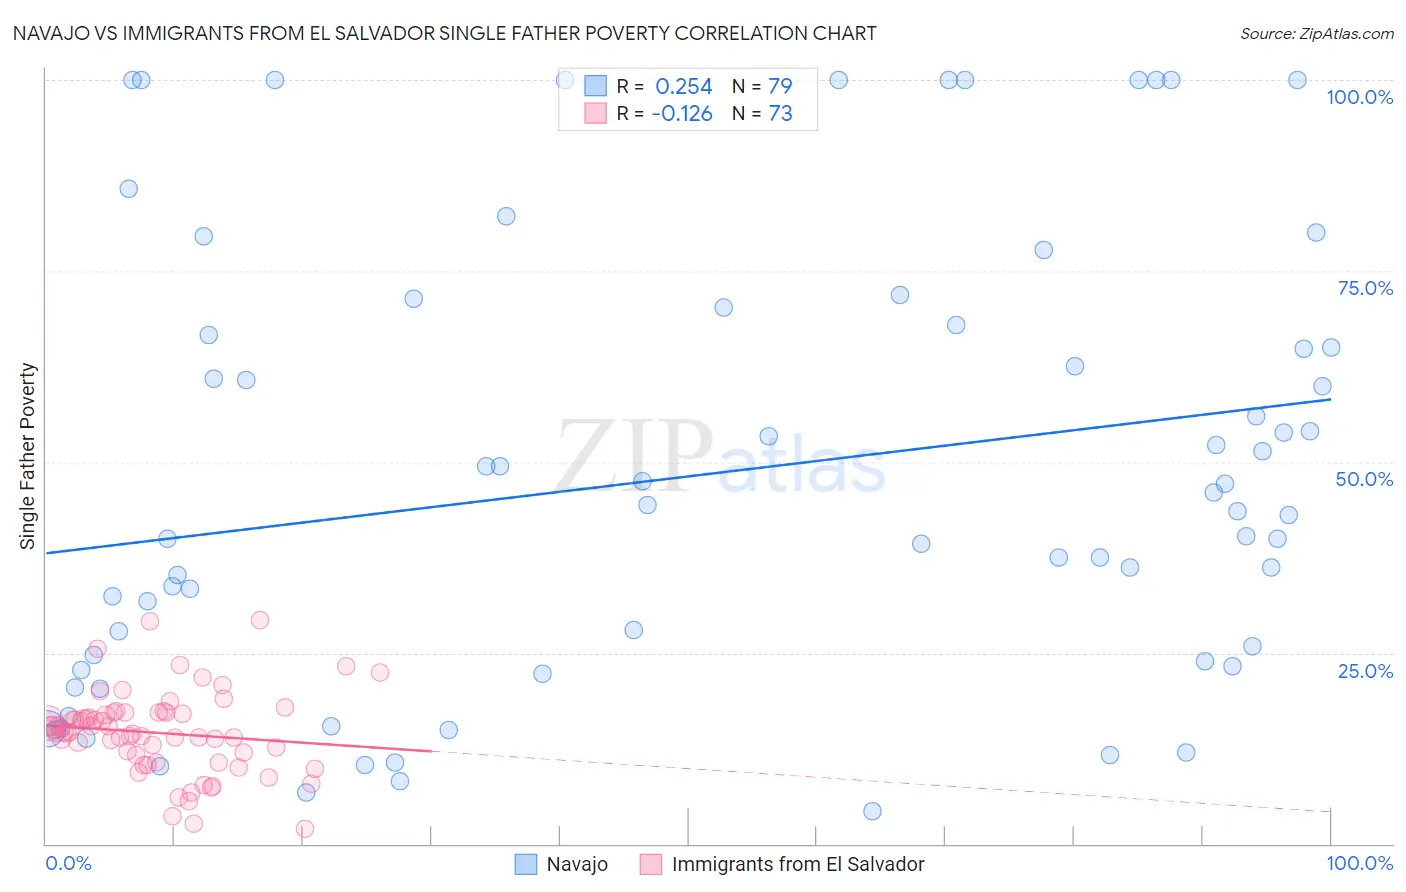
Navajo vs Immigrants from El Salvador Single Father Poverty Correlation Chart
The statistical analysis conducted on geographies consisting of 195,813,521 people shows a weak positive correlation between the proportion of Navajo and poverty level among single fathers in the United States with a correlation coefficient (R) of 0.254 and weighted average of 29.2%. Similarly, the statistical analysis conducted on geographies consisting of 292,495,730 people shows a poor negative correlation between the proportion of Immigrants from El Salvador and poverty level among single fathers in the United States with a correlation coefficient (R) of -0.126 and weighted average of 15.0%, a difference of 95.1%.
Single Father Poverty Correlation Summary
| Measurement | Navajo | Immigrants from El Salvador |
| Minimum | 4.3% | 1.9% |
| Maximum | 100.0% | 29.3% |
| Range | 95.7% | 27.4% |
| Mean | 48.2% | 14.5% |
| Median | 43.6% | 14.7% |
| Interquartile 25% (IQ1) | 23.3% | 11.1% |
| Interquartile 75% (IQ3) | 67.9% | 17.2% |
| Interquartile Range (IQR) | 44.6% | 6.0% |
| Standard Deviation (Sample) | 29.2% | 5.4% |
| Standard Deviation (Population) | 29.0% | 5.3% |
Similar Demographics by Single Father Poverty
Demographics Similar to Navajo by Single Father Poverty
In terms of single father poverty, the demographic groups most similar to Navajo are Lumbee (28.5%, a difference of 2.6%), Yuman (28.4%, a difference of 2.9%), Crow (30.3%, a difference of 3.6%), Hopi (27.2%, a difference of 7.6%), and Puerto Rican (31.5%, a difference of 7.9%).
| Demographics | Rating | Rank | Single Father Poverty |
| Natives/Alaskans | 0.0 /100 | #333 | Tragic 22.4% |
| Kiowa | 0.0 /100 | #334 | Tragic 22.5% |
| Shoshone | 0.0 /100 | #335 | Tragic 22.9% |
| Cajuns | 0.0 /100 | #336 | Tragic 23.1% |
| Sioux | 0.0 /100 | #337 | Tragic 23.9% |
| Arapaho | 0.0 /100 | #338 | Tragic 24.0% |
| Apache | 0.0 /100 | #339 | Tragic 24.2% |
| Houma | 0.0 /100 | #340 | Tragic 26.7% |
| Hopi | 0.0 /100 | #341 | Tragic 27.2% |
| Yuman | 0.0 /100 | #342 | Tragic 28.4% |
| Lumbee | 0.0 /100 | #343 | Tragic 28.5% |
| Navajo | 0.0 /100 | #344 | Tragic 29.2% |
| Crow | 0.0 /100 | #345 | Tragic 30.3% |
| Puerto Ricans | 0.0 /100 | #346 | Tragic 31.5% |
| Yup'ik | 0.0 /100 | #347 | Tragic 32.5% |
Demographics Similar to Immigrants from El Salvador by Single Father Poverty
In terms of single father poverty, the demographic groups most similar to Immigrants from El Salvador are Immigrants from Pakistan (15.0%, a difference of 0.040%), Immigrants from Kenya (15.0%, a difference of 0.040%), Bhutanese (15.0%, a difference of 0.060%), Immigrants from Eastern Asia (15.0%, a difference of 0.11%), and Immigrants from Uzbekistan (15.0%, a difference of 0.22%).
| Demographics | Rating | Rank | Single Father Poverty |
| Immigrants | Somalia | 100.0 /100 | #45 | Exceptional 14.9% |
| Immigrants | Cambodia | 99.9 /100 | #46 | Exceptional 14.9% |
| Immigrants | China | 99.9 /100 | #47 | Exceptional 14.9% |
| Malaysians | 99.9 /100 | #48 | Exceptional 14.9% |
| Immigrants | Eastern Asia | 99.9 /100 | #49 | Exceptional 15.0% |
| Bhutanese | 99.9 /100 | #50 | Exceptional 15.0% |
| Immigrants | Pakistan | 99.9 /100 | #51 | Exceptional 15.0% |
| Immigrants | El Salvador | 99.9 /100 | #52 | Exceptional 15.0% |
| Immigrants | Kenya | 99.9 /100 | #53 | Exceptional 15.0% |
| Immigrants | Uzbekistan | 99.9 /100 | #54 | Exceptional 15.0% |
| Immigrants | Bulgaria | 99.9 /100 | #55 | Exceptional 15.0% |
| Immigrants | Laos | 99.9 /100 | #56 | Exceptional 15.1% |
| Laotians | 99.9 /100 | #57 | Exceptional 15.1% |
| Hawaiians | 99.9 /100 | #58 | Exceptional 15.1% |
| Guamanians/Chamorros | 99.9 /100 | #59 | Exceptional 15.1% |