Navajo vs Vietnamese Cognitive Disability
COMPARE
Navajo
Vietnamese
Cognitive Disability
Cognitive Disability Comparison
Navajo
Vietnamese
18.8%
COGNITIVE DISABILITY
0.0/ 100
METRIC RATING
329th/ 347
METRIC RANK
17.7%
COGNITIVE DISABILITY
3.4/ 100
METRIC RATING
225th/ 347
METRIC RANK
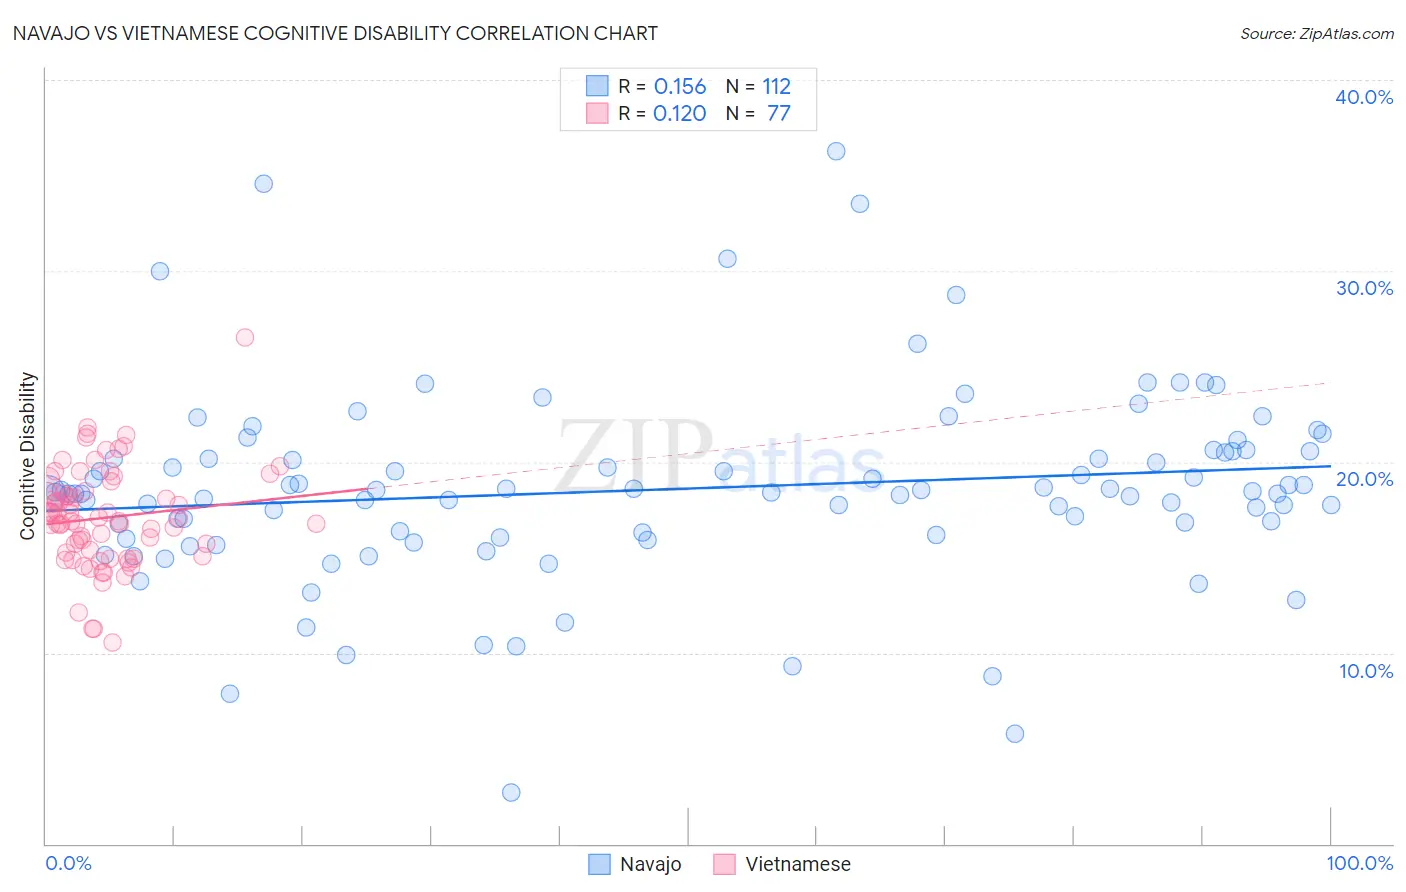
Navajo vs Vietnamese Cognitive Disability Correlation Chart
The statistical analysis conducted on geographies consisting of 224,779,988 people shows a poor positive correlation between the proportion of Navajo and percentage of population with cognitive disability in the United States with a correlation coefficient (R) of 0.156 and weighted average of 18.8%. Similarly, the statistical analysis conducted on geographies consisting of 170,756,377 people shows a poor positive correlation between the proportion of Vietnamese and percentage of population with cognitive disability in the United States with a correlation coefficient (R) of 0.120 and weighted average of 17.7%, a difference of 6.0%.
Cognitive Disability Correlation Summary
| Measurement | Navajo | Vietnamese |
| Minimum | 2.7% | 10.6% |
| Maximum | 36.3% | 26.5% |
| Range | 33.6% | 15.9% |
| Mean | 18.6% | 17.1% |
| Median | 18.4% | 16.9% |
| Interquartile 25% (IQ1) | 16.2% | 15.2% |
| Interquartile 75% (IQ3) | 20.5% | 18.5% |
| Interquartile Range (IQR) | 4.3% | 3.3% |
| Standard Deviation (Sample) | 5.1% | 2.6% |
| Standard Deviation (Population) | 5.1% | 2.6% |
Similar Demographics by Cognitive Disability
Demographics Similar to Navajo by Cognitive Disability
In terms of cognitive disability, the demographic groups most similar to Navajo are Immigrants from Dominican Republic (18.8%, a difference of 0.10%), Pima (18.8%, a difference of 0.16%), Immigrants from Sudan (18.8%, a difference of 0.18%), Kiowa (18.7%, a difference of 0.22%), and Immigrants from Yemen (18.8%, a difference of 0.24%).
| Demographics | Rating | Rank | Cognitive Disability |
| Immigrants | Liberia | 0.0 /100 | #322 | Tragic 18.7% |
| Pueblo | 0.0 /100 | #323 | Tragic 18.7% |
| Dominicans | 0.0 /100 | #324 | Tragic 18.7% |
| Indonesians | 0.0 /100 | #325 | Tragic 18.7% |
| Immigrants | Senegal | 0.0 /100 | #326 | Tragic 18.7% |
| U.S. Virgin Islanders | 0.0 /100 | #327 | Tragic 18.7% |
| Kiowa | 0.0 /100 | #328 | Tragic 18.7% |
| Navajo | 0.0 /100 | #329 | Tragic 18.8% |
| Immigrants | Dominican Republic | 0.0 /100 | #330 | Tragic 18.8% |
| Pima | 0.0 /100 | #331 | Tragic 18.8% |
| Immigrants | Sudan | 0.0 /100 | #332 | Tragic 18.8% |
| Immigrants | Yemen | 0.0 /100 | #333 | Tragic 18.8% |
| Sudanese | 0.0 /100 | #334 | Tragic 18.9% |
| Senegalese | 0.0 /100 | #335 | Tragic 19.0% |
| Blacks/African Americans | 0.0 /100 | #336 | Tragic 19.0% |
Demographics Similar to Vietnamese by Cognitive Disability
In terms of cognitive disability, the demographic groups most similar to Vietnamese are Fijian (17.7%, a difference of 0.010%), Marshallese (17.7%, a difference of 0.16%), Immigrants from St. Vincent and the Grenadines (17.7%, a difference of 0.19%), Alsatian (17.7%, a difference of 0.20%), and Central American (17.7%, a difference of 0.21%).
| Demographics | Rating | Rank | Cognitive Disability |
| Icelanders | 6.4 /100 | #218 | Tragic 17.6% |
| Immigrants | Sierra Leone | 6.3 /100 | #219 | Tragic 17.6% |
| Zimbabweans | 6.1 /100 | #220 | Tragic 17.6% |
| Moroccans | 5.9 /100 | #221 | Tragic 17.6% |
| Central Americans | 4.5 /100 | #222 | Tragic 17.7% |
| Alsatians | 4.5 /100 | #223 | Tragic 17.7% |
| Fijians | 3.4 /100 | #224 | Tragic 17.7% |
| Vietnamese | 3.4 /100 | #225 | Tragic 17.7% |
| Marshallese | 2.7 /100 | #226 | Tragic 17.7% |
| Immigrants | St. Vincent and the Grenadines | 2.6 /100 | #227 | Tragic 17.7% |
| Immigrants | Central America | 2.3 /100 | #228 | Tragic 17.7% |
| Immigrants | Guatemala | 2.2 /100 | #229 | Tragic 17.7% |
| Mongolians | 2.2 /100 | #230 | Tragic 17.7% |
| Guatemalans | 2.1 /100 | #231 | Tragic 17.8% |
| Tongans | 2.1 /100 | #232 | Tragic 17.8% |