Navajo vs Immigrants from Western Europe Single Father Poverty
COMPARE
Navajo
Immigrants from Western Europe
Single Father Poverty
Single Father Poverty Comparison
Navajo
Immigrants from Western Europe
29.2%
SINGLE FATHER POVERTY
0.0/ 100
METRIC RATING
344th/ 347
METRIC RANK
16.9%
SINGLE FATHER POVERTY
2.9/ 100
METRIC RATING
235th/ 347
METRIC RANK
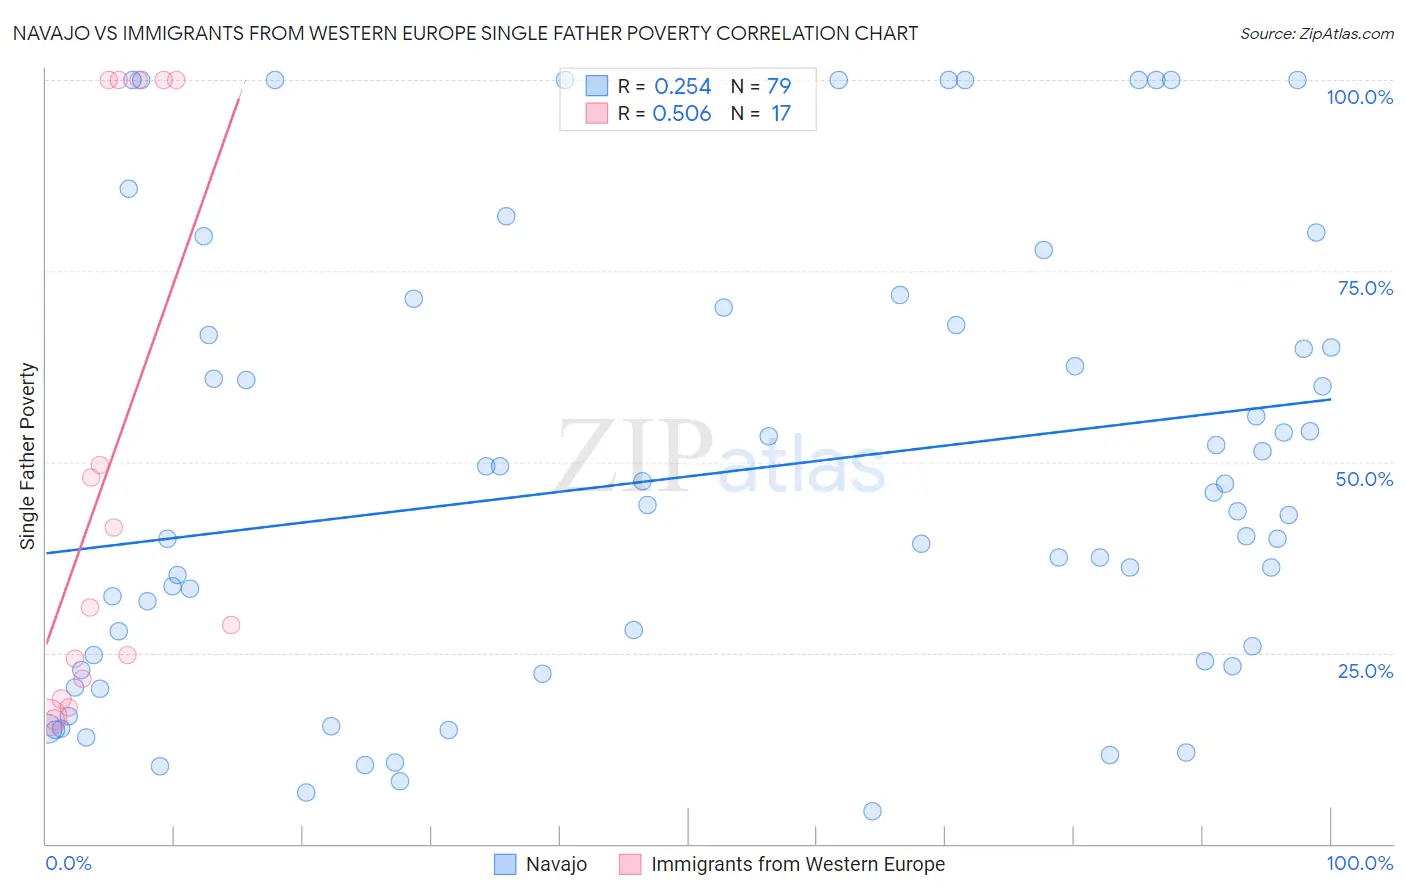
Navajo vs Immigrants from Western Europe Single Father Poverty Correlation Chart
The statistical analysis conducted on geographies consisting of 195,813,521 people shows a weak positive correlation between the proportion of Navajo and poverty level among single fathers in the United States with a correlation coefficient (R) of 0.254 and weighted average of 29.2%. Similarly, the statistical analysis conducted on geographies consisting of 371,259,131 people shows a substantial positive correlation between the proportion of Immigrants from Western Europe and poverty level among single fathers in the United States with a correlation coefficient (R) of 0.506 and weighted average of 16.9%, a difference of 72.6%.
Single Father Poverty Correlation Summary
| Measurement | Navajo | Immigrants from Western Europe |
| Minimum | 4.3% | 16.2% |
| Maximum | 100.0% | 100.0% |
| Range | 95.7% | 83.8% |
| Mean | 48.2% | 49.3% |
| Median | 43.6% | 31.0% |
| Interquartile 25% (IQ1) | 23.3% | 20.2% |
| Interquartile 75% (IQ3) | 67.9% | 100.0% |
| Interquartile Range (IQR) | 44.6% | 79.8% |
| Standard Deviation (Sample) | 29.2% | 35.1% |
| Standard Deviation (Population) | 29.0% | 34.1% |
Similar Demographics by Single Father Poverty
Demographics Similar to Navajo by Single Father Poverty
In terms of single father poverty, the demographic groups most similar to Navajo are Lumbee (28.5%, a difference of 2.6%), Yuman (28.4%, a difference of 2.9%), Crow (30.3%, a difference of 3.6%), Hopi (27.2%, a difference of 7.6%), and Puerto Rican (31.5%, a difference of 7.9%).
| Demographics | Rating | Rank | Single Father Poverty |
| Natives/Alaskans | 0.0 /100 | #333 | Tragic 22.4% |
| Kiowa | 0.0 /100 | #334 | Tragic 22.5% |
| Shoshone | 0.0 /100 | #335 | Tragic 22.9% |
| Cajuns | 0.0 /100 | #336 | Tragic 23.1% |
| Sioux | 0.0 /100 | #337 | Tragic 23.9% |
| Arapaho | 0.0 /100 | #338 | Tragic 24.0% |
| Apache | 0.0 /100 | #339 | Tragic 24.2% |
| Houma | 0.0 /100 | #340 | Tragic 26.7% |
| Hopi | 0.0 /100 | #341 | Tragic 27.2% |
| Yuman | 0.0 /100 | #342 | Tragic 28.4% |
| Lumbee | 0.0 /100 | #343 | Tragic 28.5% |
| Navajo | 0.0 /100 | #344 | Tragic 29.2% |
| Crow | 0.0 /100 | #345 | Tragic 30.3% |
| Puerto Ricans | 0.0 /100 | #346 | Tragic 31.5% |
| Yup'ik | 0.0 /100 | #347 | Tragic 32.5% |
Demographics Similar to Immigrants from Western Europe by Single Father Poverty
In terms of single father poverty, the demographic groups most similar to Immigrants from Western Europe are Immigrants from Germany (16.9%, a difference of 0.0%), Subsaharan African (16.9%, a difference of 0.0%), Immigrants from Saudi Arabia (16.9%, a difference of 0.070%), Bermudan (16.9%, a difference of 0.090%), and Marshallese (16.9%, a difference of 0.10%).
| Demographics | Rating | Rank | Single Father Poverty |
| Belgians | 5.3 /100 | #228 | Tragic 16.8% |
| Israelis | 4.6 /100 | #229 | Tragic 16.8% |
| Immigrants | Trinidad and Tobago | 4.5 /100 | #230 | Tragic 16.8% |
| Spanish Americans | 3.7 /100 | #231 | Tragic 16.9% |
| Immigrants | Grenada | 3.7 /100 | #232 | Tragic 16.9% |
| Senegalese | 3.2 /100 | #233 | Tragic 16.9% |
| Marshallese | 3.1 /100 | #234 | Tragic 16.9% |
| Immigrants | Western Europe | 2.9 /100 | #235 | Tragic 16.9% |
| Immigrants | Germany | 2.9 /100 | #236 | Tragic 16.9% |
| Sub-Saharan Africans | 2.9 /100 | #237 | Tragic 16.9% |
| Immigrants | Saudi Arabia | 2.7 /100 | #238 | Tragic 16.9% |
| Bermudans | 2.6 /100 | #239 | Tragic 16.9% |
| Finns | 2.6 /100 | #240 | Tragic 16.9% |
| Czechs | 2.3 /100 | #241 | Tragic 17.0% |
| Moroccans | 2.1 /100 | #242 | Tragic 17.0% |