Immigrants from Eritrea vs Immigrants from Italy Poverty
COMPARE
Immigrants from Eritrea
Immigrants from Italy
Poverty
Poverty Comparison
Immigrants from Eritrea
Immigrants from Italy
13.4%
POVERTY
2.4/ 100
METRIC RATING
224th/ 347
METRIC RANK
11.2%
POVERTY
97.9/ 100
METRIC RATING
61st/ 347
METRIC RANK
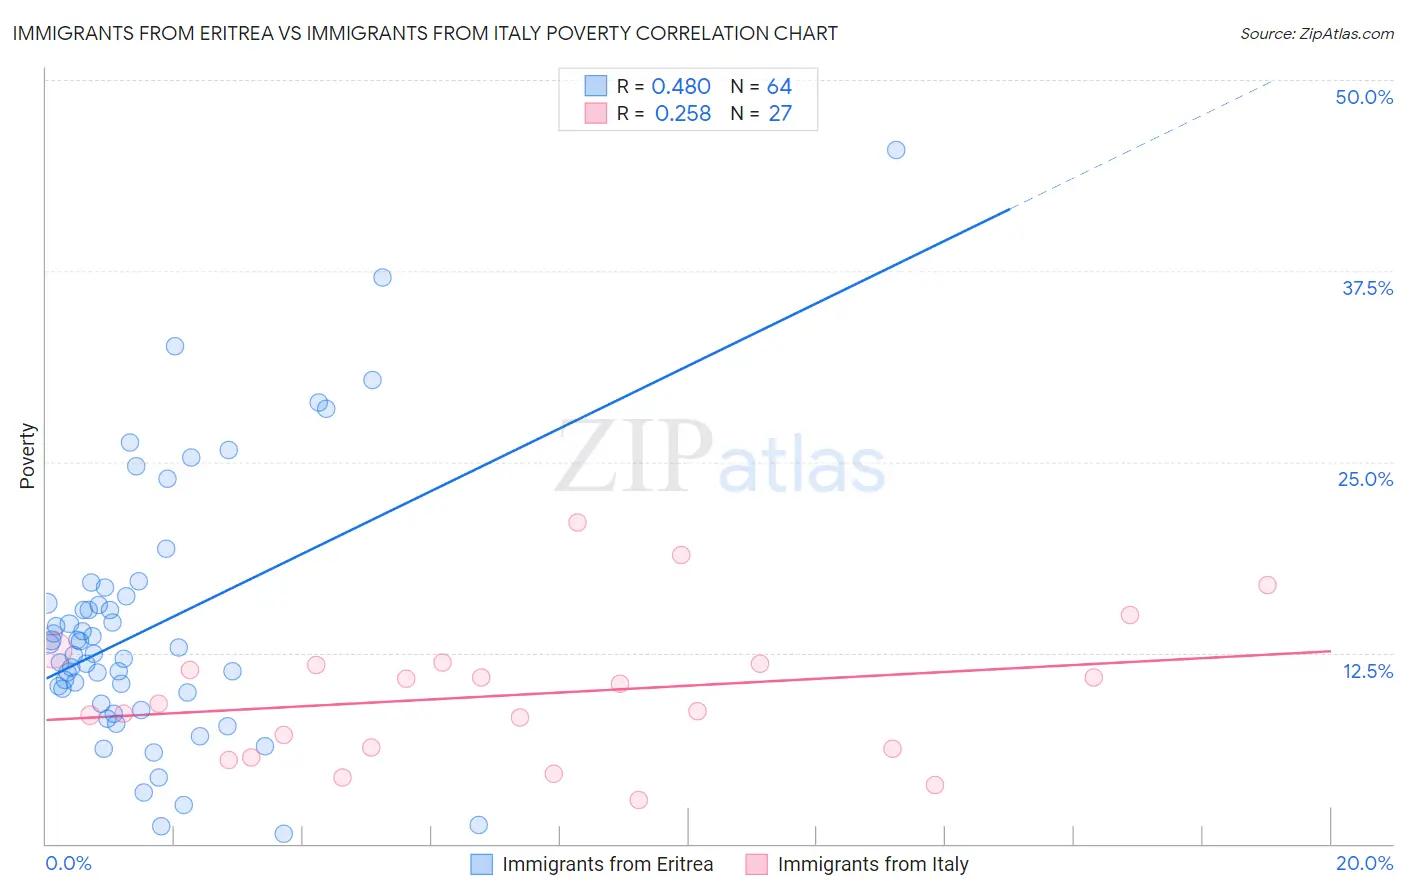
Immigrants from Eritrea vs Immigrants from Italy Poverty Correlation Chart
The statistical analysis conducted on geographies consisting of 104,846,826 people shows a moderate positive correlation between the proportion of Immigrants from Eritrea and poverty level in the United States with a correlation coefficient (R) of 0.480 and weighted average of 13.4%. Similarly, the statistical analysis conducted on geographies consisting of 324,121,527 people shows a weak positive correlation between the proportion of Immigrants from Italy and poverty level in the United States with a correlation coefficient (R) of 0.258 and weighted average of 11.2%, a difference of 20.1%.
Poverty Correlation Summary
| Measurement | Immigrants from Eritrea | Immigrants from Italy |
| Minimum | 0.62% | 2.9% |
| Maximum | 45.5% | 21.0% |
| Range | 44.8% | 18.1% |
| Mean | 14.2% | 9.8% |
| Median | 12.6% | 9.2% |
| Interquartile 25% (IQ1) | 9.5% | 6.2% |
| Interquartile 75% (IQ3) | 16.0% | 11.8% |
| Interquartile Range (IQR) | 6.4% | 5.5% |
| Standard Deviation (Sample) | 8.6% | 4.5% |
| Standard Deviation (Population) | 8.5% | 4.4% |
Similar Demographics by Poverty
Demographics Similar to Immigrants from Eritrea by Poverty
In terms of poverty, the demographic groups most similar to Immigrants from Eritrea are Immigrants from Africa (13.4%, a difference of 0.10%), Immigrants from Micronesia (13.4%, a difference of 0.14%), Alsatian (13.4%, a difference of 0.18%), German Russian (13.4%, a difference of 0.22%), and Marshallese (13.4%, a difference of 0.23%).
| Demographics | Rating | Rank | Poverty |
| Immigrants | Uzbekistan | 3.2 /100 | #217 | Tragic 13.3% |
| Immigrants | Thailand | 3.1 /100 | #218 | Tragic 13.3% |
| Immigrants | Cambodia | 3.0 /100 | #219 | Tragic 13.4% |
| Americans | 2.9 /100 | #220 | Tragic 13.4% |
| Alsatians | 2.6 /100 | #221 | Tragic 13.4% |
| Immigrants | Micronesia | 2.6 /100 | #222 | Tragic 13.4% |
| Immigrants | Africa | 2.5 /100 | #223 | Tragic 13.4% |
| Immigrants | Eritrea | 2.4 /100 | #224 | Tragic 13.4% |
| German Russians | 2.2 /100 | #225 | Tragic 13.4% |
| Marshallese | 2.2 /100 | #226 | Tragic 13.4% |
| Alaska Natives | 2.1 /100 | #227 | Tragic 13.5% |
| Immigrants | Nigeria | 1.7 /100 | #228 | Tragic 13.5% |
| Osage | 1.5 /100 | #229 | Tragic 13.6% |
| Alaskan Athabascans | 1.5 /100 | #230 | Tragic 13.6% |
| Nigerians | 1.4 /100 | #231 | Tragic 13.6% |
Demographics Similar to Immigrants from Italy by Poverty
In terms of poverty, the demographic groups most similar to Immigrants from Italy are Austrian (11.2%, a difference of 0.030%), Ukrainian (11.2%, a difference of 0.040%), Immigrants from Sri Lanka (11.2%, a difference of 0.060%), Immigrants from Europe (11.2%, a difference of 0.22%), and Swiss (11.2%, a difference of 0.25%).
| Demographics | Rating | Rank | Poverty |
| Immigrants | Bulgaria | 98.5 /100 | #54 | Exceptional 11.1% |
| Immigrants | Serbia | 98.5 /100 | #55 | Exceptional 11.1% |
| Estonians | 98.2 /100 | #56 | Exceptional 11.1% |
| Scandinavians | 98.2 /100 | #57 | Exceptional 11.1% |
| Germans | 98.1 /100 | #58 | Exceptional 11.1% |
| Immigrants | Europe | 98.0 /100 | #59 | Exceptional 11.2% |
| Immigrants | Sri Lanka | 97.9 /100 | #60 | Exceptional 11.2% |
| Immigrants | Italy | 97.9 /100 | #61 | Exceptional 11.2% |
| Austrians | 97.8 /100 | #62 | Exceptional 11.2% |
| Ukrainians | 97.8 /100 | #63 | Exceptional 11.2% |
| Swiss | 97.7 /100 | #64 | Exceptional 11.2% |
| Immigrants | Asia | 97.5 /100 | #65 | Exceptional 11.2% |
| Immigrants | Netherlands | 97.5 /100 | #66 | Exceptional 11.2% |
| Immigrants | Australia | 97.4 /100 | #67 | Exceptional 11.2% |
| Slovaks | 97.4 /100 | #68 | Exceptional 11.2% |