Northern European vs Immigrants from Italy Poverty
COMPARE
Northern European
Immigrants from Italy
Poverty
Poverty Comparison
Northern Europeans
Immigrants from Italy
11.4%
POVERTY
96.0/ 100
METRIC RATING
87th/ 347
METRIC RANK
11.2%
POVERTY
97.9/ 100
METRIC RATING
61st/ 347
METRIC RANK
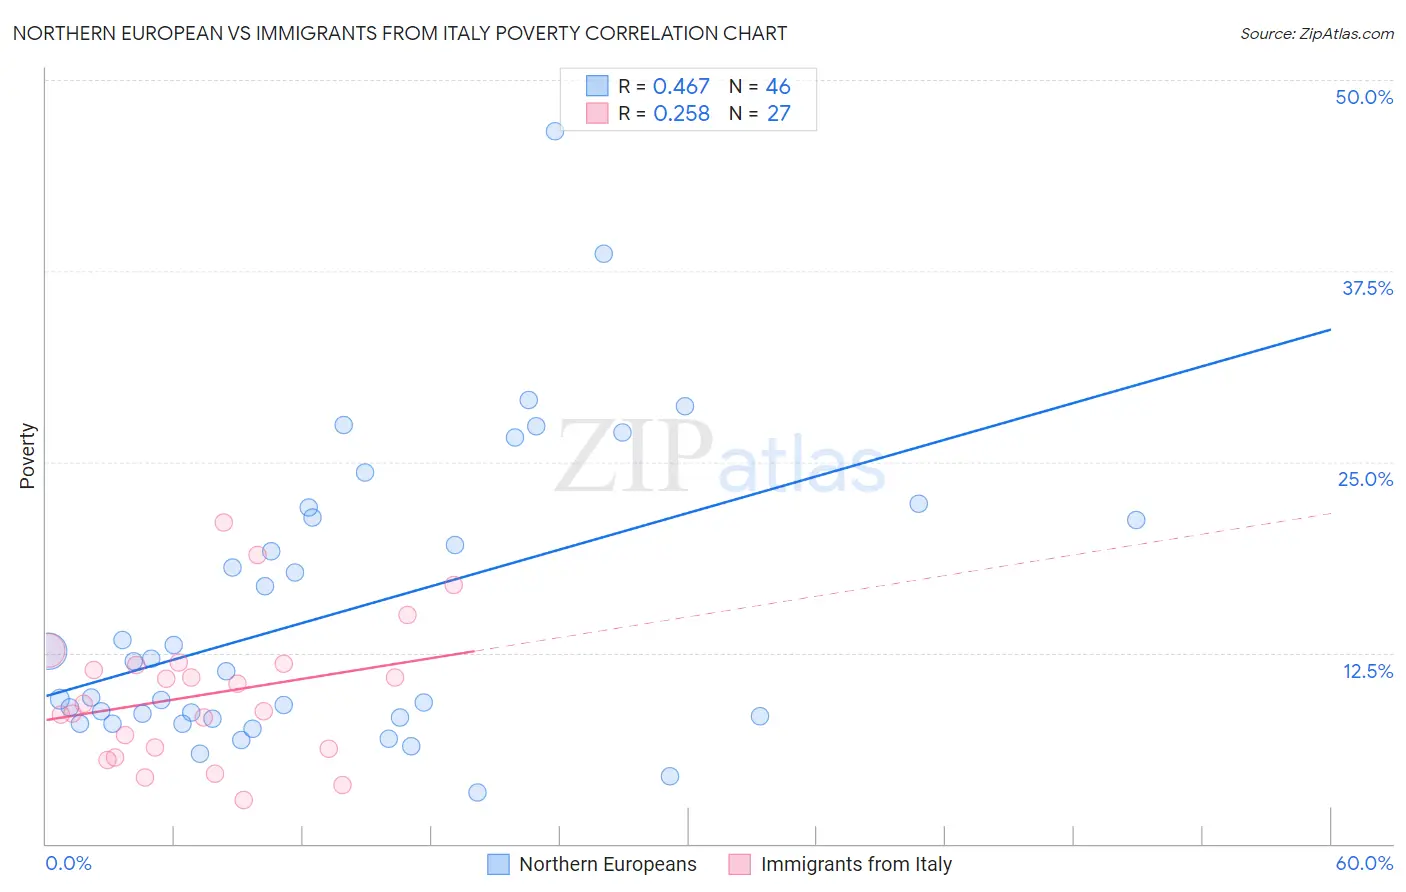
Northern European vs Immigrants from Italy Poverty Correlation Chart
The statistical analysis conducted on geographies consisting of 405,898,980 people shows a moderate positive correlation between the proportion of Northern Europeans and poverty level in the United States with a correlation coefficient (R) of 0.467 and weighted average of 11.4%. Similarly, the statistical analysis conducted on geographies consisting of 324,121,527 people shows a weak positive correlation between the proportion of Immigrants from Italy and poverty level in the United States with a correlation coefficient (R) of 0.258 and weighted average of 11.2%, a difference of 1.7%.
Poverty Correlation Summary
| Measurement | Northern European | Immigrants from Italy |
| Minimum | 3.3% | 2.9% |
| Maximum | 46.6% | 21.0% |
| Range | 43.3% | 18.1% |
| Mean | 15.2% | 9.8% |
| Median | 11.6% | 9.2% |
| Interquartile 25% (IQ1) | 8.3% | 6.2% |
| Interquartile 75% (IQ3) | 21.4% | 11.8% |
| Interquartile Range (IQR) | 13.1% | 5.5% |
| Standard Deviation (Sample) | 9.5% | 4.5% |
| Standard Deviation (Population) | 9.4% | 4.4% |
Similar Demographics by Poverty
Demographics Similar to Northern Europeans by Poverty
In terms of poverty, the demographic groups most similar to Northern Europeans are Jordanian (11.4%, a difference of 0.0%), Immigrants from England (11.4%, a difference of 0.12%), Belgian (11.4%, a difference of 0.14%), Czechoslovakian (11.4%, a difference of 0.18%), and English (11.3%, a difference of 0.19%).
| Demographics | Rating | Rank | Poverty |
| Indians (Asian) | 96.6 /100 | #80 | Exceptional 11.3% |
| Irish | 96.6 /100 | #81 | Exceptional 11.3% |
| Egyptians | 96.5 /100 | #82 | Exceptional 11.3% |
| Immigrants | Sweden | 96.3 /100 | #83 | Exceptional 11.3% |
| English | 96.3 /100 | #84 | Exceptional 11.3% |
| Immigrants | England | 96.2 /100 | #85 | Exceptional 11.4% |
| Jordanians | 96.0 /100 | #86 | Exceptional 11.4% |
| Northern Europeans | 96.0 /100 | #87 | Exceptional 11.4% |
| Belgians | 95.8 /100 | #88 | Exceptional 11.4% |
| Czechoslovakians | 95.7 /100 | #89 | Exceptional 11.4% |
| Immigrants | Denmark | 95.5 /100 | #90 | Exceptional 11.4% |
| Finns | 95.2 /100 | #91 | Exceptional 11.4% |
| British | 95.0 /100 | #92 | Exceptional 11.4% |
| Romanians | 94.9 /100 | #93 | Exceptional 11.4% |
| Paraguayans | 94.9 /100 | #94 | Exceptional 11.4% |
Demographics Similar to Immigrants from Italy by Poverty
In terms of poverty, the demographic groups most similar to Immigrants from Italy are Austrian (11.2%, a difference of 0.030%), Ukrainian (11.2%, a difference of 0.040%), Immigrants from Sri Lanka (11.2%, a difference of 0.060%), Immigrants from Europe (11.2%, a difference of 0.22%), and Swiss (11.2%, a difference of 0.25%).
| Demographics | Rating | Rank | Poverty |
| Immigrants | Bulgaria | 98.5 /100 | #54 | Exceptional 11.1% |
| Immigrants | Serbia | 98.5 /100 | #55 | Exceptional 11.1% |
| Estonians | 98.2 /100 | #56 | Exceptional 11.1% |
| Scandinavians | 98.2 /100 | #57 | Exceptional 11.1% |
| Germans | 98.1 /100 | #58 | Exceptional 11.1% |
| Immigrants | Europe | 98.0 /100 | #59 | Exceptional 11.2% |
| Immigrants | Sri Lanka | 97.9 /100 | #60 | Exceptional 11.2% |
| Immigrants | Italy | 97.9 /100 | #61 | Exceptional 11.2% |
| Austrians | 97.8 /100 | #62 | Exceptional 11.2% |
| Ukrainians | 97.8 /100 | #63 | Exceptional 11.2% |
| Swiss | 97.7 /100 | #64 | Exceptional 11.2% |
| Immigrants | Asia | 97.5 /100 | #65 | Exceptional 11.2% |
| Immigrants | Netherlands | 97.5 /100 | #66 | Exceptional 11.2% |
| Immigrants | Australia | 97.4 /100 | #67 | Exceptional 11.2% |
| Slovaks | 97.4 /100 | #68 | Exceptional 11.2% |