Immigrants from Serbia vs Immigrants from Italy Poverty
COMPARE
Immigrants from Serbia
Immigrants from Italy
Poverty
Poverty Comparison
Immigrants from Serbia
Immigrants from Italy
11.1%
POVERTY
98.5/ 100
METRIC RATING
55th/ 347
METRIC RANK
11.2%
POVERTY
97.9/ 100
METRIC RATING
61st/ 347
METRIC RANK
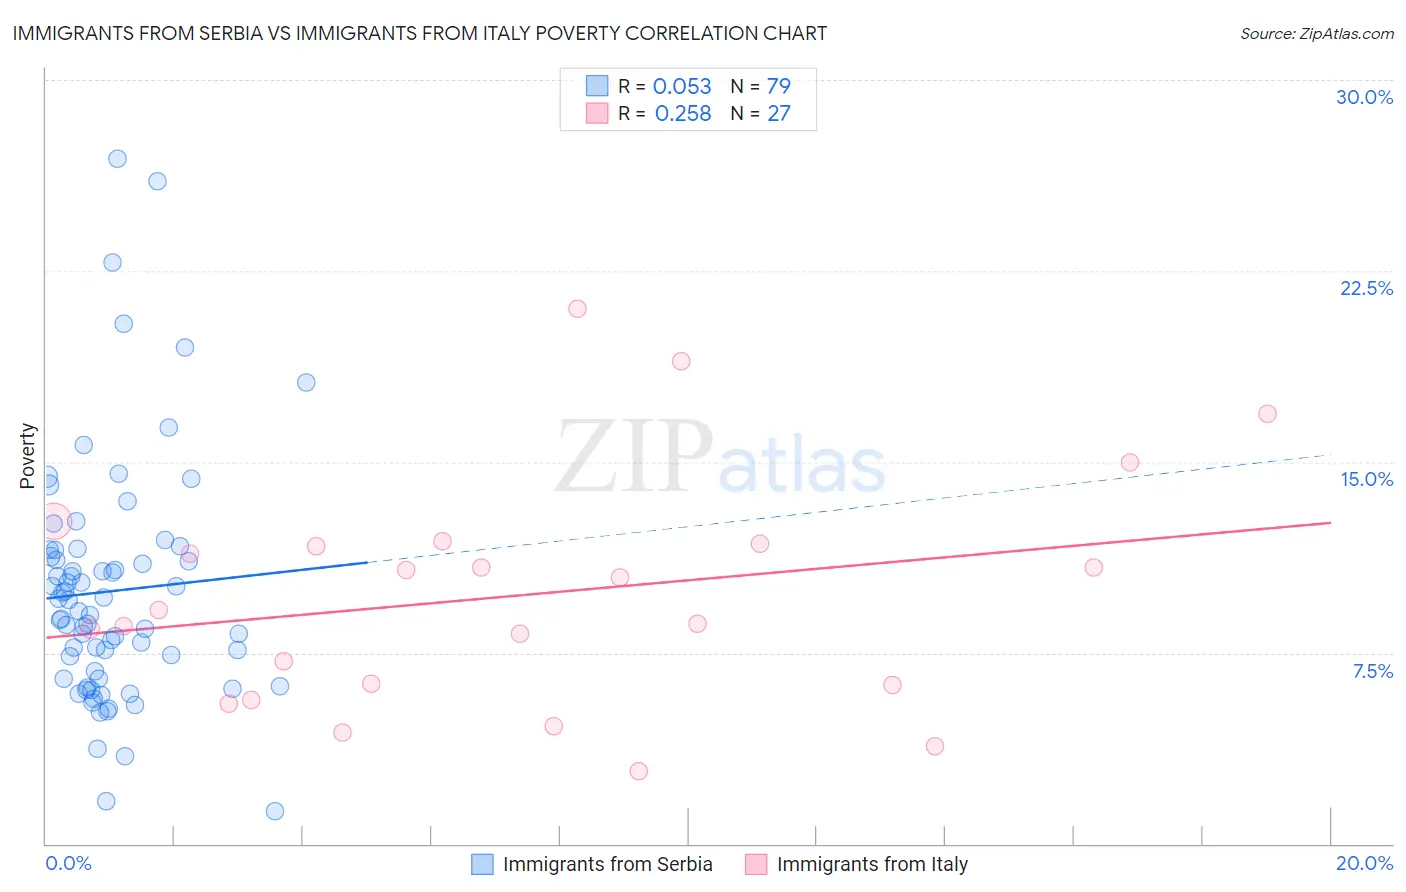
Immigrants from Serbia vs Immigrants from Italy Poverty Correlation Chart
The statistical analysis conducted on geographies consisting of 131,733,920 people shows a slight positive correlation between the proportion of Immigrants from Serbia and poverty level in the United States with a correlation coefficient (R) of 0.053 and weighted average of 11.1%. Similarly, the statistical analysis conducted on geographies consisting of 324,121,527 people shows a weak positive correlation between the proportion of Immigrants from Italy and poverty level in the United States with a correlation coefficient (R) of 0.258 and weighted average of 11.2%, a difference of 0.96%.
Poverty Correlation Summary
| Measurement | Immigrants from Serbia | Immigrants from Italy |
| Minimum | 1.3% | 2.9% |
| Maximum | 26.9% | 21.0% |
| Range | 25.6% | 18.1% |
| Mean | 9.9% | 9.8% |
| Median | 9.1% | 9.2% |
| Interquartile 25% (IQ1) | 6.5% | 6.2% |
| Interquartile 75% (IQ3) | 11.5% | 11.8% |
| Interquartile Range (IQR) | 5.1% | 5.5% |
| Standard Deviation (Sample) | 4.7% | 4.5% |
| Standard Deviation (Population) | 4.7% | 4.4% |
Demographics Similar to Immigrants from Serbia and Immigrants from Italy by Poverty
In terms of poverty, the demographic groups most similar to Immigrants from Serbia are Immigrants from Bulgaria (11.1%, a difference of 0.030%), Immigrants from Austria (11.1%, a difference of 0.15%), Immigrants from Philippines (11.0%, a difference of 0.37%), Immigrants from Croatia (11.0%, a difference of 0.39%), and Estonian (11.1%, a difference of 0.48%). Similarly, the demographic groups most similar to Immigrants from Italy are Austrian (11.2%, a difference of 0.030%), Ukrainian (11.2%, a difference of 0.040%), Immigrants from Sri Lanka (11.2%, a difference of 0.060%), Immigrants from Europe (11.2%, a difference of 0.22%), and Swiss (11.2%, a difference of 0.25%).
| Demographics | Rating | Rank | Poverty |
| Slovenes | 98.9 /100 | #48 | Exceptional 11.0% |
| Immigrants | Japan | 98.9 /100 | #49 | Exceptional 11.0% |
| Asians | 98.9 /100 | #50 | Exceptional 11.0% |
| Immigrants | Croatia | 98.7 /100 | #51 | Exceptional 11.0% |
| Immigrants | Philippines | 98.7 /100 | #52 | Exceptional 11.0% |
| Immigrants | Austria | 98.6 /100 | #53 | Exceptional 11.1% |
| Immigrants | Bulgaria | 98.5 /100 | #54 | Exceptional 11.1% |
| Immigrants | Serbia | 98.5 /100 | #55 | Exceptional 11.1% |
| Estonians | 98.2 /100 | #56 | Exceptional 11.1% |
| Scandinavians | 98.2 /100 | #57 | Exceptional 11.1% |
| Germans | 98.1 /100 | #58 | Exceptional 11.1% |
| Immigrants | Europe | 98.0 /100 | #59 | Exceptional 11.2% |
| Immigrants | Sri Lanka | 97.9 /100 | #60 | Exceptional 11.2% |
| Immigrants | Italy | 97.9 /100 | #61 | Exceptional 11.2% |
| Austrians | 97.8 /100 | #62 | Exceptional 11.2% |
| Ukrainians | 97.8 /100 | #63 | Exceptional 11.2% |
| Swiss | 97.7 /100 | #64 | Exceptional 11.2% |
| Immigrants | Asia | 97.5 /100 | #65 | Exceptional 11.2% |
| Immigrants | Netherlands | 97.5 /100 | #66 | Exceptional 11.2% |
| Immigrants | Australia | 97.4 /100 | #67 | Exceptional 11.2% |
| Slovaks | 97.4 /100 | #68 | Exceptional 11.2% |