Native/Alaskan vs Paraguayan 1 or more Vehicles in Household
COMPARE
Native/Alaskan
Paraguayan
1 or more Vehicles in Household
1 or more Vehicles in Household Comparison
Natives/Alaskans
Paraguayans
89.8%
1 OR MORE VEHICLES IN HOUSEHOLD
59.5/ 100
METRIC RATING
169th/ 347
METRIC RANK
85.7%
1 OR MORE VEHICLES IN HOUSEHOLD
0.0/ 100
METRIC RATING
297th/ 347
METRIC RANK
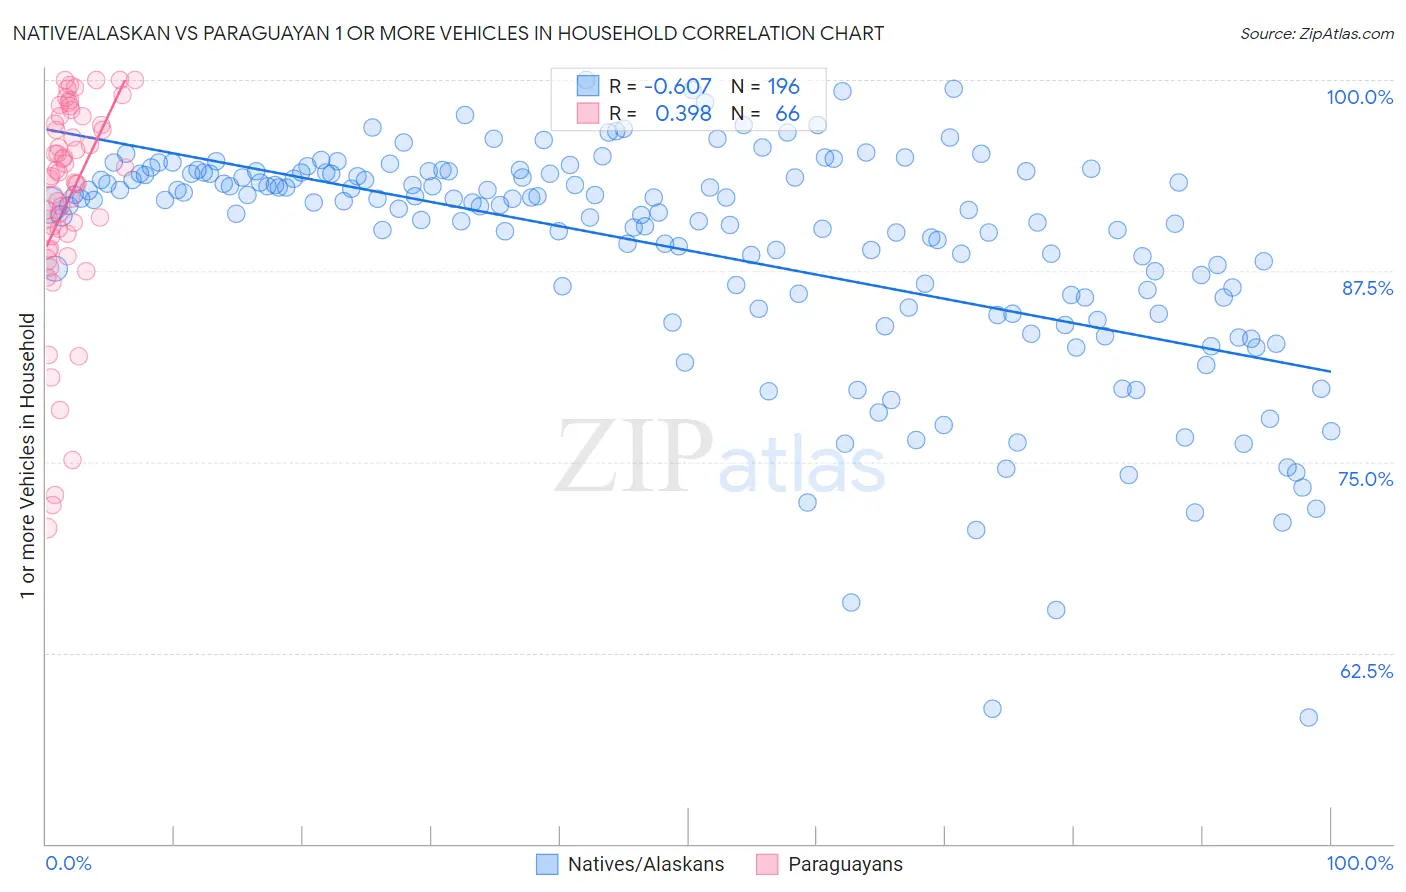
Native/Alaskan vs Paraguayan 1 or more Vehicles in Household Correlation Chart
The statistical analysis conducted on geographies consisting of 512,700,478 people shows a significant negative correlation between the proportion of Natives/Alaskans and percentage of households with 1 or more vehicles available in the United States with a correlation coefficient (R) of -0.607 and weighted average of 89.8%. Similarly, the statistical analysis conducted on geographies consisting of 94,974,257 people shows a mild positive correlation between the proportion of Paraguayans and percentage of households with 1 or more vehicles available in the United States with a correlation coefficient (R) of 0.398 and weighted average of 85.7%, a difference of 4.8%.
1 or more Vehicles in Household Correlation Summary
| Measurement | Native/Alaskan | Paraguayan |
| Minimum | 58.3% | 70.7% |
| Maximum | 100.0% | 100.0% |
| Range | 41.7% | 29.3% |
| Mean | 88.9% | 92.1% |
| Median | 91.8% | 93.6% |
| Interquartile 25% (IQ1) | 85.8% | 89.7% |
| Interquartile 75% (IQ3) | 93.9% | 97.1% |
| Interquartile Range (IQR) | 8.1% | 7.4% |
| Standard Deviation (Sample) | 7.6% | 7.0% |
| Standard Deviation (Population) | 7.6% | 6.9% |
Similar Demographics by 1 or more Vehicles in Household
Demographics Similar to Natives/Alaskans by 1 or more Vehicles in Household
In terms of 1 or more vehicles in household, the demographic groups most similar to Natives/Alaskans are Immigrants from Latin America (89.8%, a difference of 0.010%), Immigrants from Cambodia (89.8%, a difference of 0.010%), Immigrants from Costa Rica (89.8%, a difference of 0.030%), Immigrants from Middle Africa (89.9%, a difference of 0.040%), and Immigrants from Saudi Arabia (89.9%, a difference of 0.050%).
| Demographics | Rating | Rank | 1 or more Vehicles in Household |
| Spanish American Indians | 67.0 /100 | #162 | Good 89.9% |
| Immigrants | Austria | 65.5 /100 | #163 | Good 89.9% |
| Comanche | 63.4 /100 | #164 | Good 89.9% |
| Immigrants | Saudi Arabia | 62.6 /100 | #165 | Good 89.9% |
| Immigrants | Middle Africa | 62.2 /100 | #166 | Good 89.9% |
| Immigrants | Latin America | 60.3 /100 | #167 | Good 89.8% |
| Immigrants | Cambodia | 60.1 /100 | #168 | Good 89.8% |
| Natives/Alaskans | 59.5 /100 | #169 | Average 89.8% |
| Immigrants | Costa Rica | 57.6 /100 | #170 | Average 89.8% |
| French American Indians | 54.4 /100 | #171 | Average 89.8% |
| Indonesians | 53.0 /100 | #172 | Average 89.7% |
| Lumbee | 52.8 /100 | #173 | Average 89.7% |
| Filipinos | 50.0 /100 | #174 | Average 89.7% |
| Immigrants | Burma/Myanmar | 47.6 /100 | #175 | Average 89.7% |
| Immigrants | Sudan | 47.1 /100 | #176 | Average 89.7% |
Demographics Similar to Paraguayans by 1 or more Vehicles in Household
In terms of 1 or more vehicles in household, the demographic groups most similar to Paraguayans are Belizean (85.7%, a difference of 0.080%), Immigrants from Spain (85.8%, a difference of 0.090%), Immigrants from Jamaica (85.8%, a difference of 0.12%), Alaskan Athabascan (86.0%, a difference of 0.29%), and Yuman (85.5%, a difference of 0.33%).
| Demographics | Rating | Rank | 1 or more Vehicles in Household |
| Immigrants | Australia | 0.0 /100 | #290 | Tragic 86.4% |
| Pima | 0.0 /100 | #291 | Tragic 86.3% |
| Okinawans | 0.0 /100 | #292 | Tragic 86.1% |
| Indians (Asian) | 0.0 /100 | #293 | Tragic 86.0% |
| Alaskan Athabascans | 0.0 /100 | #294 | Tragic 86.0% |
| Immigrants | Jamaica | 0.0 /100 | #295 | Tragic 85.8% |
| Immigrants | Spain | 0.0 /100 | #296 | Tragic 85.8% |
| Paraguayans | 0.0 /100 | #297 | Tragic 85.7% |
| Belizeans | 0.0 /100 | #298 | Tragic 85.7% |
| Yuman | 0.0 /100 | #299 | Tragic 85.5% |
| Immigrants | Russia | 0.0 /100 | #300 | Tragic 85.4% |
| Immigrants | Panama | 0.0 /100 | #301 | Tragic 85.4% |
| Moroccans | 0.0 /100 | #302 | Tragic 85.4% |
| Immigrants | Greece | 0.0 /100 | #303 | Tragic 85.4% |
| Immigrants | Ukraine | 0.0 /100 | #304 | Tragic 85.2% |