Mongolian vs West Indian Single Father Poverty
COMPARE
Mongolian
West Indian
Single Father Poverty
Single Father Poverty Comparison
Mongolians
West Indians
15.3%
SINGLE FATHER POVERTY
99.7/ 100
METRIC RATING
70th/ 347
METRIC RANK
18.0%
SINGLE FATHER POVERTY
0.0/ 100
METRIC RATING
290th/ 347
METRIC RANK
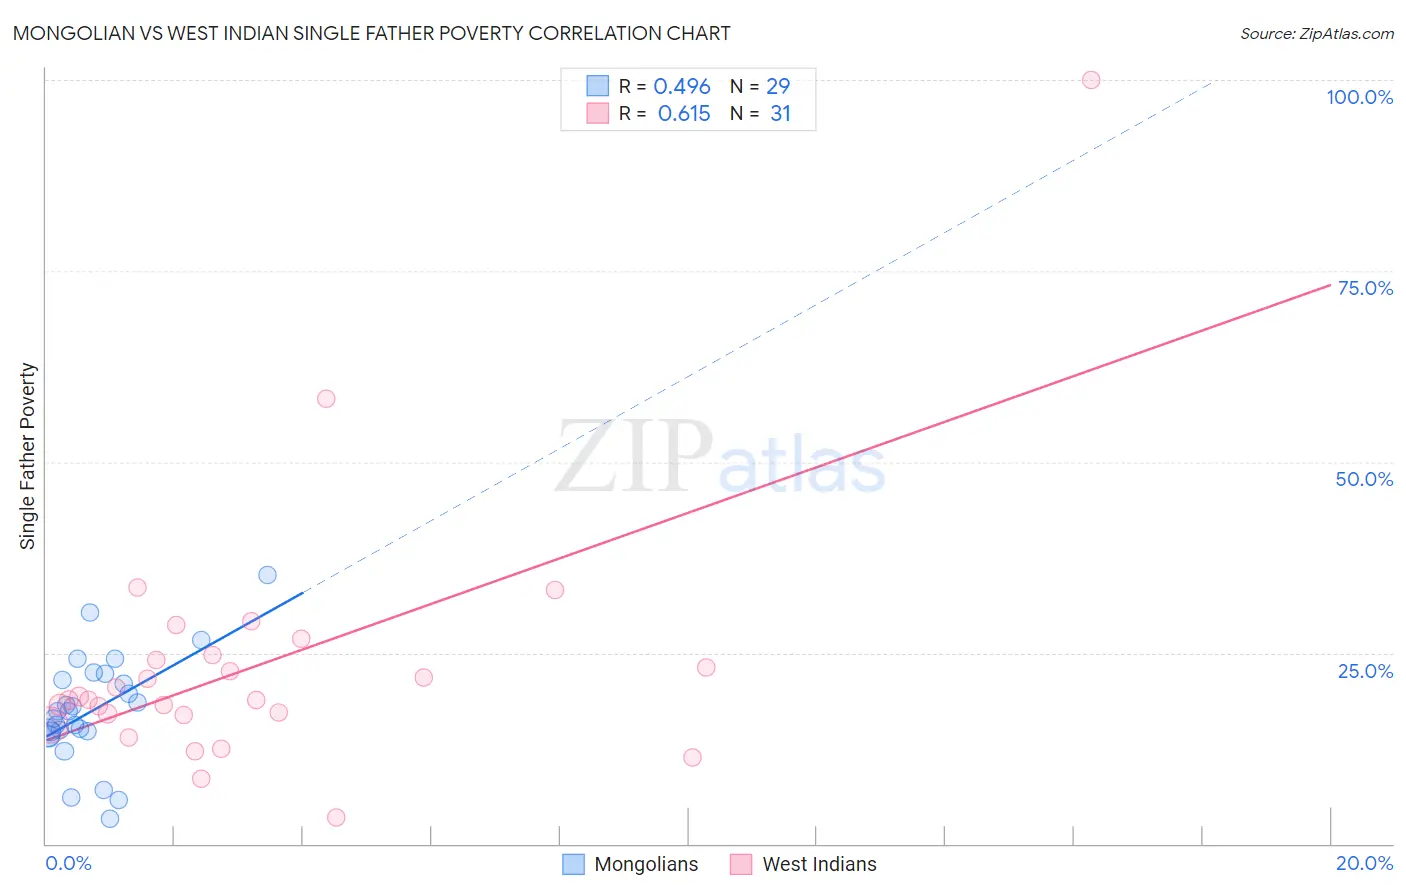
Mongolian vs West Indian Single Father Poverty Correlation Chart
The statistical analysis conducted on geographies consisting of 122,619,201 people shows a moderate positive correlation between the proportion of Mongolians and poverty level among single fathers in the United States with a correlation coefficient (R) of 0.496 and weighted average of 15.3%. Similarly, the statistical analysis conducted on geographies consisting of 216,434,953 people shows a significant positive correlation between the proportion of West Indians and poverty level among single fathers in the United States with a correlation coefficient (R) of 0.615 and weighted average of 18.0%, a difference of 18.3%.
Single Father Poverty Correlation Summary
| Measurement | Mongolian | West Indian |
| Minimum | 3.3% | 3.5% |
| Maximum | 35.2% | 100.0% |
| Range | 31.9% | 96.5% |
| Mean | 17.5% | 23.4% |
| Median | 17.4% | 18.9% |
| Interquartile 25% (IQ1) | 14.6% | 16.8% |
| Interquartile 75% (IQ3) | 21.8% | 24.6% |
| Interquartile Range (IQR) | 7.2% | 7.8% |
| Standard Deviation (Sample) | 7.1% | 17.1% |
| Standard Deviation (Population) | 6.9% | 16.9% |
Similar Demographics by Single Father Poverty
Demographics Similar to Mongolians by Single Father Poverty
In terms of single father poverty, the demographic groups most similar to Mongolians are Japanese (15.2%, a difference of 0.10%), Immigrants from Cameroon (15.2%, a difference of 0.13%), Paraguayan (15.2%, a difference of 0.21%), Immigrants from Brazil (15.3%, a difference of 0.21%), and Immigrants from Moldova (15.2%, a difference of 0.30%).
| Demographics | Rating | Rank | Single Father Poverty |
| Immigrants | Sweden | 99.8 /100 | #63 | Exceptional 15.2% |
| Bangladeshis | 99.8 /100 | #64 | Exceptional 15.2% |
| Immigrants | Malaysia | 99.8 /100 | #65 | Exceptional 15.2% |
| Immigrants | Moldova | 99.8 /100 | #66 | Exceptional 15.2% |
| Paraguayans | 99.7 /100 | #67 | Exceptional 15.2% |
| Immigrants | Cameroon | 99.7 /100 | #68 | Exceptional 15.2% |
| Japanese | 99.7 /100 | #69 | Exceptional 15.2% |
| Mongolians | 99.7 /100 | #70 | Exceptional 15.3% |
| Immigrants | Brazil | 99.6 /100 | #71 | Exceptional 15.3% |
| Immigrants | Lithuania | 99.6 /100 | #72 | Exceptional 15.3% |
| Kenyans | 99.6 /100 | #73 | Exceptional 15.3% |
| Maltese | 99.6 /100 | #74 | Exceptional 15.3% |
| Immigrants | Turkey | 99.5 /100 | #75 | Exceptional 15.3% |
| Immigrants | Japan | 99.5 /100 | #76 | Exceptional 15.3% |
| Immigrants | Peru | 99.5 /100 | #77 | Exceptional 15.3% |
Demographics Similar to West Indians by Single Father Poverty
In terms of single father poverty, the demographic groups most similar to West Indians are Irish (18.0%, a difference of 0.030%), Alaskan Athabascan (18.1%, a difference of 0.22%), Immigrants from Bahamas (18.1%, a difference of 0.23%), Alaska Native (18.1%, a difference of 0.34%), and U.S. Virgin Islander (18.1%, a difference of 0.36%).
| Demographics | Rating | Rank | Single Father Poverty |
| Alsatians | 0.0 /100 | #283 | Tragic 17.8% |
| Welsh | 0.0 /100 | #284 | Tragic 17.8% |
| Immigrants | Lebanon | 0.0 /100 | #285 | Tragic 17.9% |
| Immigrants | North Macedonia | 0.0 /100 | #286 | Tragic 17.9% |
| Carpatho Rusyns | 0.0 /100 | #287 | Tragic 18.0% |
| Bahamians | 0.0 /100 | #288 | Tragic 18.0% |
| Irish | 0.0 /100 | #289 | Tragic 18.0% |
| West Indians | 0.0 /100 | #290 | Tragic 18.0% |
| Alaskan Athabascans | 0.0 /100 | #291 | Tragic 18.1% |
| Immigrants | Bahamas | 0.0 /100 | #292 | Tragic 18.1% |
| Alaska Natives | 0.0 /100 | #293 | Tragic 18.1% |
| U.S. Virgin Islanders | 0.0 /100 | #294 | Tragic 18.1% |
| Yakama | 0.0 /100 | #295 | Tragic 18.1% |
| Seminole | 0.0 /100 | #296 | Tragic 18.1% |
| French | 0.0 /100 | #297 | Tragic 18.2% |