Sioux vs West Indian Single Father Poverty
COMPARE
Sioux
West Indian
Single Father Poverty
Single Father Poverty Comparison
Sioux
West Indians
23.9%
SINGLE FATHER POVERTY
0.0/ 100
METRIC RATING
337th/ 347
METRIC RANK
18.0%
SINGLE FATHER POVERTY
0.0/ 100
METRIC RATING
290th/ 347
METRIC RANK
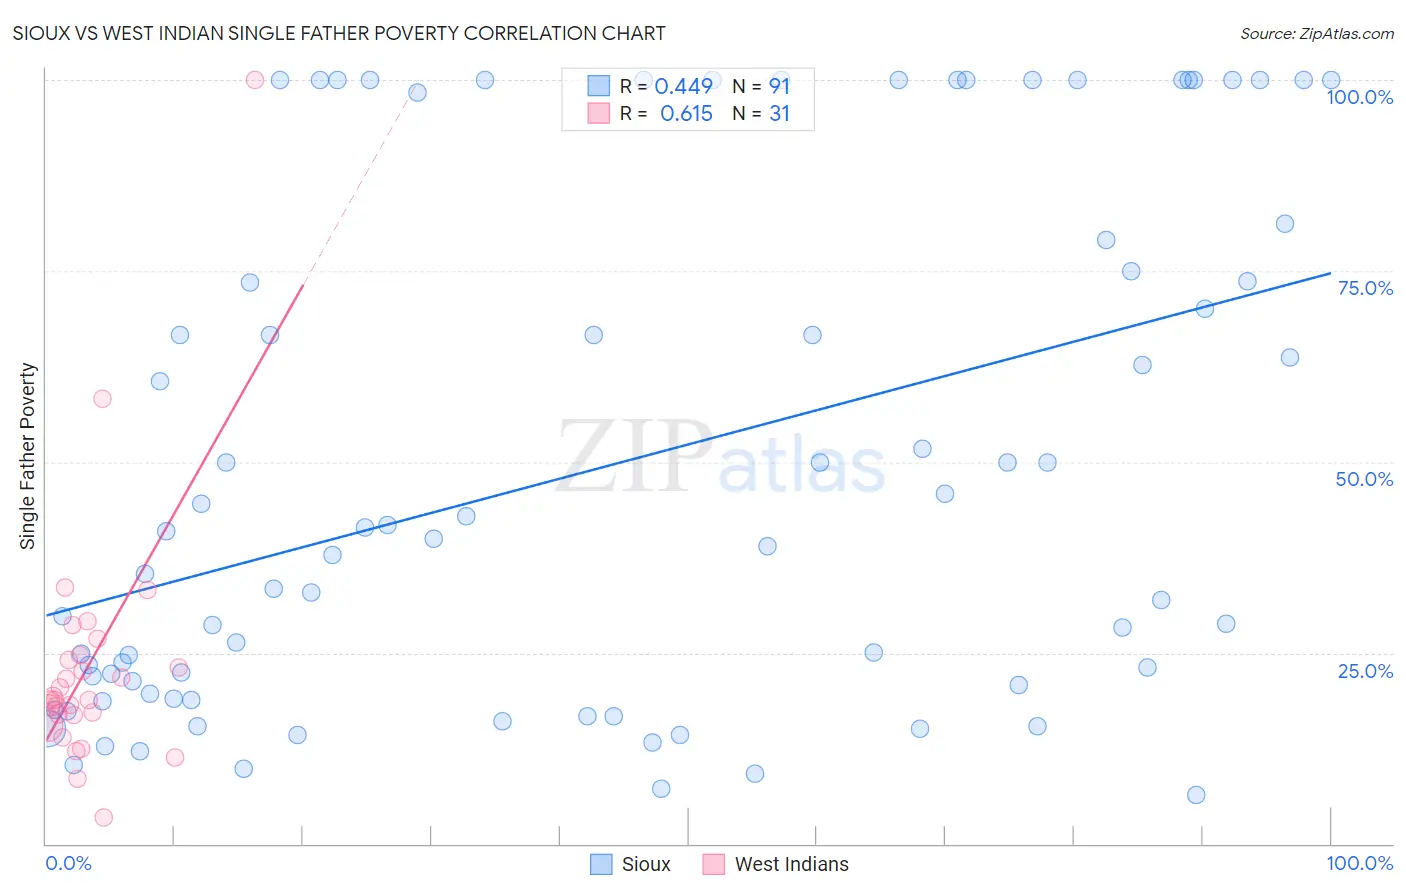
Sioux vs West Indian Single Father Poverty Correlation Chart
The statistical analysis conducted on geographies consisting of 199,784,577 people shows a moderate positive correlation between the proportion of Sioux and poverty level among single fathers in the United States with a correlation coefficient (R) of 0.449 and weighted average of 23.9%. Similarly, the statistical analysis conducted on geographies consisting of 216,434,953 people shows a significant positive correlation between the proportion of West Indians and poverty level among single fathers in the United States with a correlation coefficient (R) of 0.615 and weighted average of 18.0%, a difference of 32.3%.
Single Father Poverty Correlation Summary
| Measurement | Sioux | West Indian |
| Minimum | 6.4% | 3.5% |
| Maximum | 100.0% | 100.0% |
| Range | 93.6% | 96.5% |
| Mean | 49.3% | 23.4% |
| Median | 40.0% | 18.9% |
| Interquartile 25% (IQ1) | 19.7% | 16.8% |
| Interquartile 75% (IQ3) | 79.0% | 24.6% |
| Interquartile Range (IQR) | 59.4% | 7.8% |
| Standard Deviation (Sample) | 33.2% | 17.1% |
| Standard Deviation (Population) | 33.1% | 16.9% |
Similar Demographics by Single Father Poverty
Demographics Similar to Sioux by Single Father Poverty
In terms of single father poverty, the demographic groups most similar to Sioux are Arapaho (24.0%, a difference of 0.41%), Apache (24.2%, a difference of 1.5%), Cajun (23.1%, a difference of 3.5%), Shoshone (22.9%, a difference of 4.2%), and Kiowa (22.5%, a difference of 6.3%).
| Demographics | Rating | Rank | Single Father Poverty |
| Paiute | 0.0 /100 | #330 | Tragic 21.6% |
| Central American Indians | 0.0 /100 | #331 | Tragic 21.7% |
| Tohono O'odham | 0.0 /100 | #332 | Tragic 22.0% |
| Natives/Alaskans | 0.0 /100 | #333 | Tragic 22.4% |
| Kiowa | 0.0 /100 | #334 | Tragic 22.5% |
| Shoshone | 0.0 /100 | #335 | Tragic 22.9% |
| Cajuns | 0.0 /100 | #336 | Tragic 23.1% |
| Sioux | 0.0 /100 | #337 | Tragic 23.9% |
| Arapaho | 0.0 /100 | #338 | Tragic 24.0% |
| Apache | 0.0 /100 | #339 | Tragic 24.2% |
| Houma | 0.0 /100 | #340 | Tragic 26.7% |
| Hopi | 0.0 /100 | #341 | Tragic 27.2% |
| Yuman | 0.0 /100 | #342 | Tragic 28.4% |
| Lumbee | 0.0 /100 | #343 | Tragic 28.5% |
| Navajo | 0.0 /100 | #344 | Tragic 29.2% |
Demographics Similar to West Indians by Single Father Poverty
In terms of single father poverty, the demographic groups most similar to West Indians are Irish (18.0%, a difference of 0.030%), Alaskan Athabascan (18.1%, a difference of 0.22%), Immigrants from Bahamas (18.1%, a difference of 0.23%), Alaska Native (18.1%, a difference of 0.34%), and U.S. Virgin Islander (18.1%, a difference of 0.36%).
| Demographics | Rating | Rank | Single Father Poverty |
| Alsatians | 0.0 /100 | #283 | Tragic 17.8% |
| Welsh | 0.0 /100 | #284 | Tragic 17.8% |
| Immigrants | Lebanon | 0.0 /100 | #285 | Tragic 17.9% |
| Immigrants | North Macedonia | 0.0 /100 | #286 | Tragic 17.9% |
| Carpatho Rusyns | 0.0 /100 | #287 | Tragic 18.0% |
| Bahamians | 0.0 /100 | #288 | Tragic 18.0% |
| Irish | 0.0 /100 | #289 | Tragic 18.0% |
| West Indians | 0.0 /100 | #290 | Tragic 18.0% |
| Alaskan Athabascans | 0.0 /100 | #291 | Tragic 18.1% |
| Immigrants | Bahamas | 0.0 /100 | #292 | Tragic 18.1% |
| Alaska Natives | 0.0 /100 | #293 | Tragic 18.1% |
| U.S. Virgin Islanders | 0.0 /100 | #294 | Tragic 18.1% |
| Yakama | 0.0 /100 | #295 | Tragic 18.1% |
| Seminole | 0.0 /100 | #296 | Tragic 18.1% |
| French | 0.0 /100 | #297 | Tragic 18.2% |