Mongolian vs Sioux Single Father Poverty
COMPARE
Mongolian
Sioux
Single Father Poverty
Single Father Poverty Comparison
Mongolians
Sioux
15.3%
SINGLE FATHER POVERTY
99.7/ 100
METRIC RATING
70th/ 347
METRIC RANK
23.9%
SINGLE FATHER POVERTY
0.0/ 100
METRIC RATING
337th/ 347
METRIC RANK
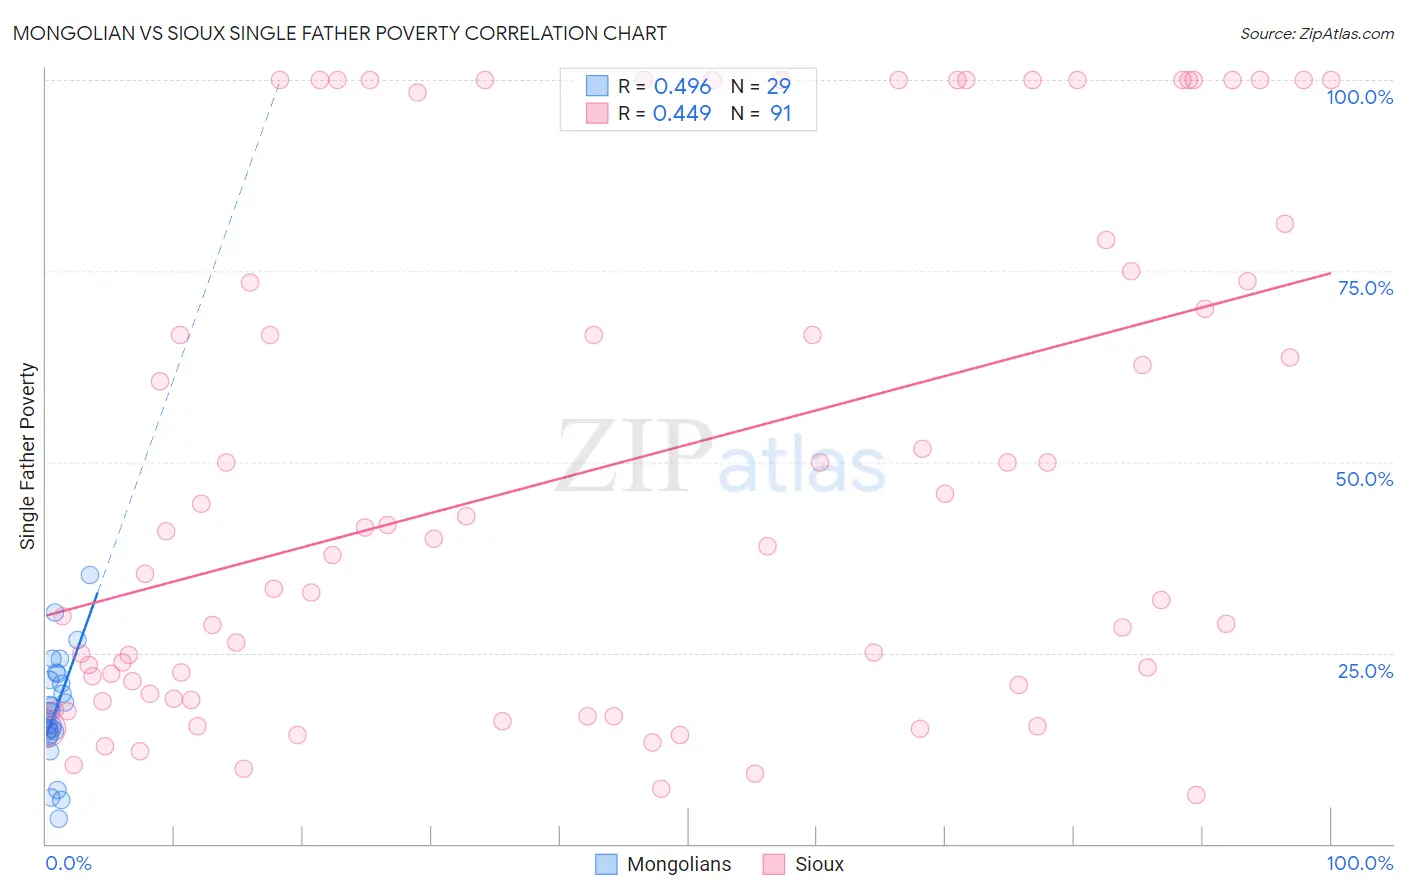
Mongolian vs Sioux Single Father Poverty Correlation Chart
The statistical analysis conducted on geographies consisting of 122,619,201 people shows a moderate positive correlation between the proportion of Mongolians and poverty level among single fathers in the United States with a correlation coefficient (R) of 0.496 and weighted average of 15.3%. Similarly, the statistical analysis conducted on geographies consisting of 199,784,577 people shows a moderate positive correlation between the proportion of Sioux and poverty level among single fathers in the United States with a correlation coefficient (R) of 0.449 and weighted average of 23.9%, a difference of 56.6%.
Single Father Poverty Correlation Summary
| Measurement | Mongolian | Sioux |
| Minimum | 3.3% | 6.4% |
| Maximum | 35.2% | 100.0% |
| Range | 31.9% | 93.6% |
| Mean | 17.5% | 49.3% |
| Median | 17.4% | 40.0% |
| Interquartile 25% (IQ1) | 14.6% | 19.7% |
| Interquartile 75% (IQ3) | 21.8% | 79.0% |
| Interquartile Range (IQR) | 7.2% | 59.4% |
| Standard Deviation (Sample) | 7.1% | 33.2% |
| Standard Deviation (Population) | 6.9% | 33.1% |
Similar Demographics by Single Father Poverty
Demographics Similar to Mongolians by Single Father Poverty
In terms of single father poverty, the demographic groups most similar to Mongolians are Japanese (15.2%, a difference of 0.10%), Immigrants from Cameroon (15.2%, a difference of 0.13%), Paraguayan (15.2%, a difference of 0.21%), Immigrants from Brazil (15.3%, a difference of 0.21%), and Immigrants from Moldova (15.2%, a difference of 0.30%).
| Demographics | Rating | Rank | Single Father Poverty |
| Immigrants | Sweden | 99.8 /100 | #63 | Exceptional 15.2% |
| Bangladeshis | 99.8 /100 | #64 | Exceptional 15.2% |
| Immigrants | Malaysia | 99.8 /100 | #65 | Exceptional 15.2% |
| Immigrants | Moldova | 99.8 /100 | #66 | Exceptional 15.2% |
| Paraguayans | 99.7 /100 | #67 | Exceptional 15.2% |
| Immigrants | Cameroon | 99.7 /100 | #68 | Exceptional 15.2% |
| Japanese | 99.7 /100 | #69 | Exceptional 15.2% |
| Mongolians | 99.7 /100 | #70 | Exceptional 15.3% |
| Immigrants | Brazil | 99.6 /100 | #71 | Exceptional 15.3% |
| Immigrants | Lithuania | 99.6 /100 | #72 | Exceptional 15.3% |
| Kenyans | 99.6 /100 | #73 | Exceptional 15.3% |
| Maltese | 99.6 /100 | #74 | Exceptional 15.3% |
| Immigrants | Turkey | 99.5 /100 | #75 | Exceptional 15.3% |
| Immigrants | Japan | 99.5 /100 | #76 | Exceptional 15.3% |
| Immigrants | Peru | 99.5 /100 | #77 | Exceptional 15.3% |
Demographics Similar to Sioux by Single Father Poverty
In terms of single father poverty, the demographic groups most similar to Sioux are Arapaho (24.0%, a difference of 0.41%), Apache (24.2%, a difference of 1.5%), Cajun (23.1%, a difference of 3.5%), Shoshone (22.9%, a difference of 4.2%), and Kiowa (22.5%, a difference of 6.3%).
| Demographics | Rating | Rank | Single Father Poverty |
| Paiute | 0.0 /100 | #330 | Tragic 21.6% |
| Central American Indians | 0.0 /100 | #331 | Tragic 21.7% |
| Tohono O'odham | 0.0 /100 | #332 | Tragic 22.0% |
| Natives/Alaskans | 0.0 /100 | #333 | Tragic 22.4% |
| Kiowa | 0.0 /100 | #334 | Tragic 22.5% |
| Shoshone | 0.0 /100 | #335 | Tragic 22.9% |
| Cajuns | 0.0 /100 | #336 | Tragic 23.1% |
| Sioux | 0.0 /100 | #337 | Tragic 23.9% |
| Arapaho | 0.0 /100 | #338 | Tragic 24.0% |
| Apache | 0.0 /100 | #339 | Tragic 24.2% |
| Houma | 0.0 /100 | #340 | Tragic 26.7% |
| Hopi | 0.0 /100 | #341 | Tragic 27.2% |
| Yuman | 0.0 /100 | #342 | Tragic 28.4% |
| Lumbee | 0.0 /100 | #343 | Tragic 28.5% |
| Navajo | 0.0 /100 | #344 | Tragic 29.2% |