Mongolian vs Immigrants from Afghanistan Single Father Poverty
COMPARE
Mongolian
Immigrants from Afghanistan
Single Father Poverty
Single Father Poverty Comparison
Mongolians
Immigrants from Afghanistan
15.3%
SINGLE FATHER POVERTY
99.7/ 100
METRIC RATING
70th/ 347
METRIC RANK
14.3%
SINGLE FATHER POVERTY
100.0/ 100
METRIC RATING
21st/ 347
METRIC RANK
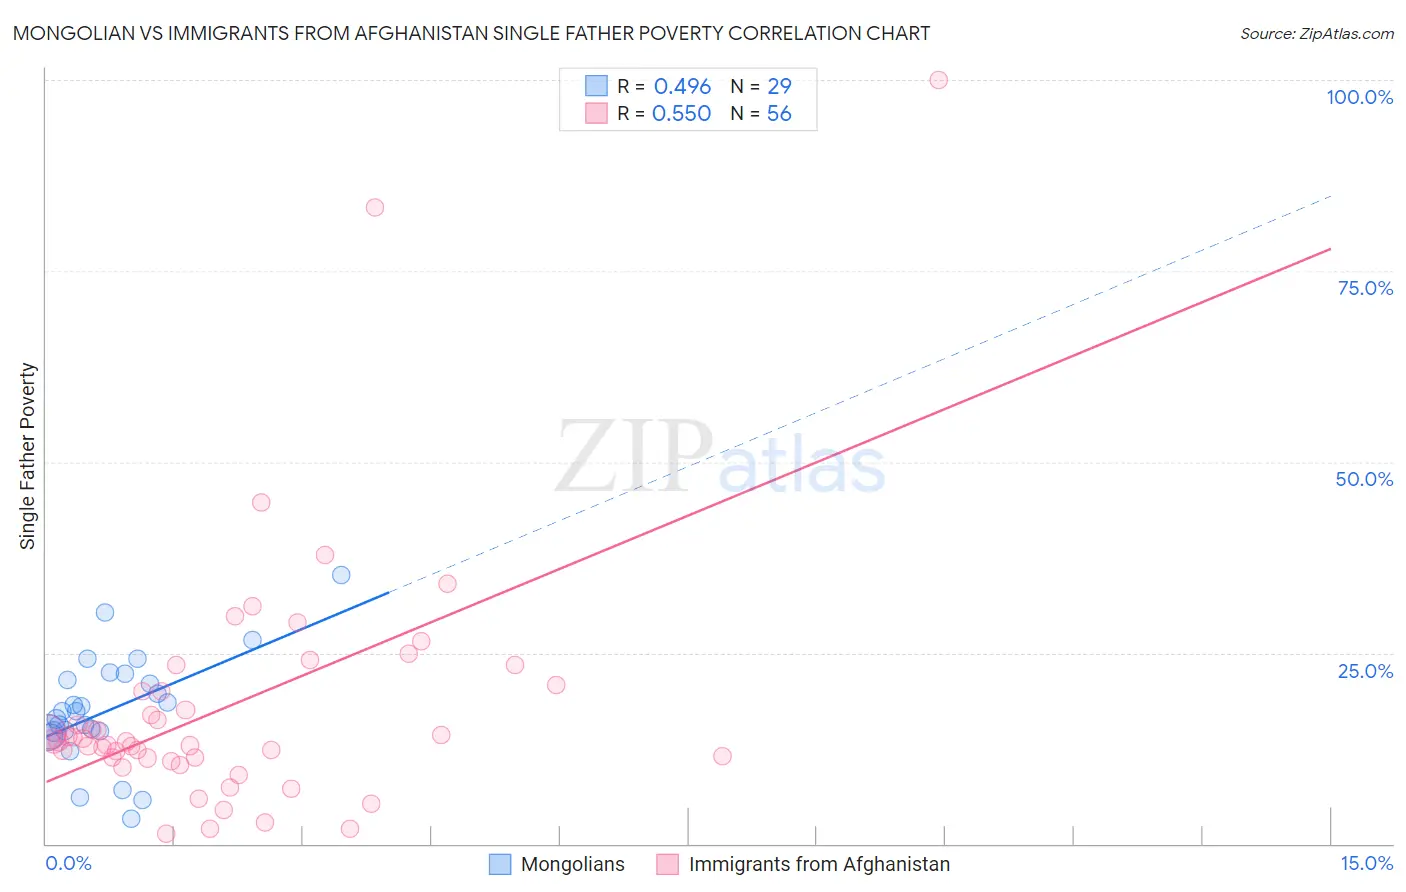
Mongolian vs Immigrants from Afghanistan Single Father Poverty Correlation Chart
The statistical analysis conducted on geographies consisting of 122,619,201 people shows a moderate positive correlation between the proportion of Mongolians and poverty level among single fathers in the United States with a correlation coefficient (R) of 0.496 and weighted average of 15.3%. Similarly, the statistical analysis conducted on geographies consisting of 129,306,719 people shows a substantial positive correlation between the proportion of Immigrants from Afghanistan and poverty level among single fathers in the United States with a correlation coefficient (R) of 0.550 and weighted average of 14.3%, a difference of 6.8%.
Single Father Poverty Correlation Summary
| Measurement | Mongolian | Immigrants from Afghanistan |
| Minimum | 3.3% | 1.3% |
| Maximum | 35.2% | 100.0% |
| Range | 31.9% | 98.7% |
| Mean | 17.5% | 18.1% |
| Median | 17.4% | 13.4% |
| Interquartile 25% (IQ1) | 14.6% | 11.2% |
| Interquartile 75% (IQ3) | 21.8% | 20.4% |
| Interquartile Range (IQR) | 7.2% | 9.1% |
| Standard Deviation (Sample) | 7.1% | 16.9% |
| Standard Deviation (Population) | 6.9% | 16.7% |
Similar Demographics by Single Father Poverty
Demographics Similar to Mongolians by Single Father Poverty
In terms of single father poverty, the demographic groups most similar to Mongolians are Japanese (15.2%, a difference of 0.10%), Immigrants from Cameroon (15.2%, a difference of 0.13%), Paraguayan (15.2%, a difference of 0.21%), Immigrants from Brazil (15.3%, a difference of 0.21%), and Immigrants from Moldova (15.2%, a difference of 0.30%).
| Demographics | Rating | Rank | Single Father Poverty |
| Immigrants | Sweden | 99.8 /100 | #63 | Exceptional 15.2% |
| Bangladeshis | 99.8 /100 | #64 | Exceptional 15.2% |
| Immigrants | Malaysia | 99.8 /100 | #65 | Exceptional 15.2% |
| Immigrants | Moldova | 99.8 /100 | #66 | Exceptional 15.2% |
| Paraguayans | 99.7 /100 | #67 | Exceptional 15.2% |
| Immigrants | Cameroon | 99.7 /100 | #68 | Exceptional 15.2% |
| Japanese | 99.7 /100 | #69 | Exceptional 15.2% |
| Mongolians | 99.7 /100 | #70 | Exceptional 15.3% |
| Immigrants | Brazil | 99.6 /100 | #71 | Exceptional 15.3% |
| Immigrants | Lithuania | 99.6 /100 | #72 | Exceptional 15.3% |
| Kenyans | 99.6 /100 | #73 | Exceptional 15.3% |
| Maltese | 99.6 /100 | #74 | Exceptional 15.3% |
| Immigrants | Turkey | 99.5 /100 | #75 | Exceptional 15.3% |
| Immigrants | Japan | 99.5 /100 | #76 | Exceptional 15.3% |
| Immigrants | Peru | 99.5 /100 | #77 | Exceptional 15.3% |
Demographics Similar to Immigrants from Afghanistan by Single Father Poverty
In terms of single father poverty, the demographic groups most similar to Immigrants from Afghanistan are Immigrants from Singapore (14.3%, a difference of 0.090%), Immigrants from Iraq (14.3%, a difference of 0.14%), Soviet Union (14.3%, a difference of 0.18%), Immigrants from Hong Kong (14.2%, a difference of 0.21%), and Taiwanese (14.3%, a difference of 0.33%).
| Demographics | Rating | Rank | Single Father Poverty |
| Immigrants | Vietnam | 100.0 /100 | #14 | Exceptional 14.1% |
| Sri Lankans | 100.0 /100 | #15 | Exceptional 14.2% |
| Immigrants | Iran | 100.0 /100 | #16 | Exceptional 14.2% |
| Immigrants | Hong Kong | 100.0 /100 | #17 | Exceptional 14.2% |
| Soviet Union | 100.0 /100 | #18 | Exceptional 14.3% |
| Immigrants | Iraq | 100.0 /100 | #19 | Exceptional 14.3% |
| Immigrants | Singapore | 100.0 /100 | #20 | Exceptional 14.3% |
| Immigrants | Afghanistan | 100.0 /100 | #21 | Exceptional 14.3% |
| Taiwanese | 100.0 /100 | #22 | Exceptional 14.3% |
| Immigrants | Egypt | 100.0 /100 | #23 | Exceptional 14.4% |
| Immigrants | South Eastern Asia | 100.0 /100 | #24 | Exceptional 14.4% |
| Iranians | 100.0 /100 | #25 | Exceptional 14.4% |
| Spanish American Indians | 100.0 /100 | #26 | Exceptional 14.4% |
| Nepalese | 100.0 /100 | #27 | Exceptional 14.4% |
| Immigrants | South Central Asia | 100.0 /100 | #28 | Exceptional 14.5% |