Mongolian vs West Indian 6th Grade
COMPARE
Mongolian
West Indian
6th Grade
6th Grade Comparison
Mongolians
West Indians
97.0%
6TH GRADE
46.7/ 100
METRIC RATING
177th/ 347
METRIC RANK
96.3%
6TH GRADE
0.2/ 100
METRIC RATING
269th/ 347
METRIC RANK
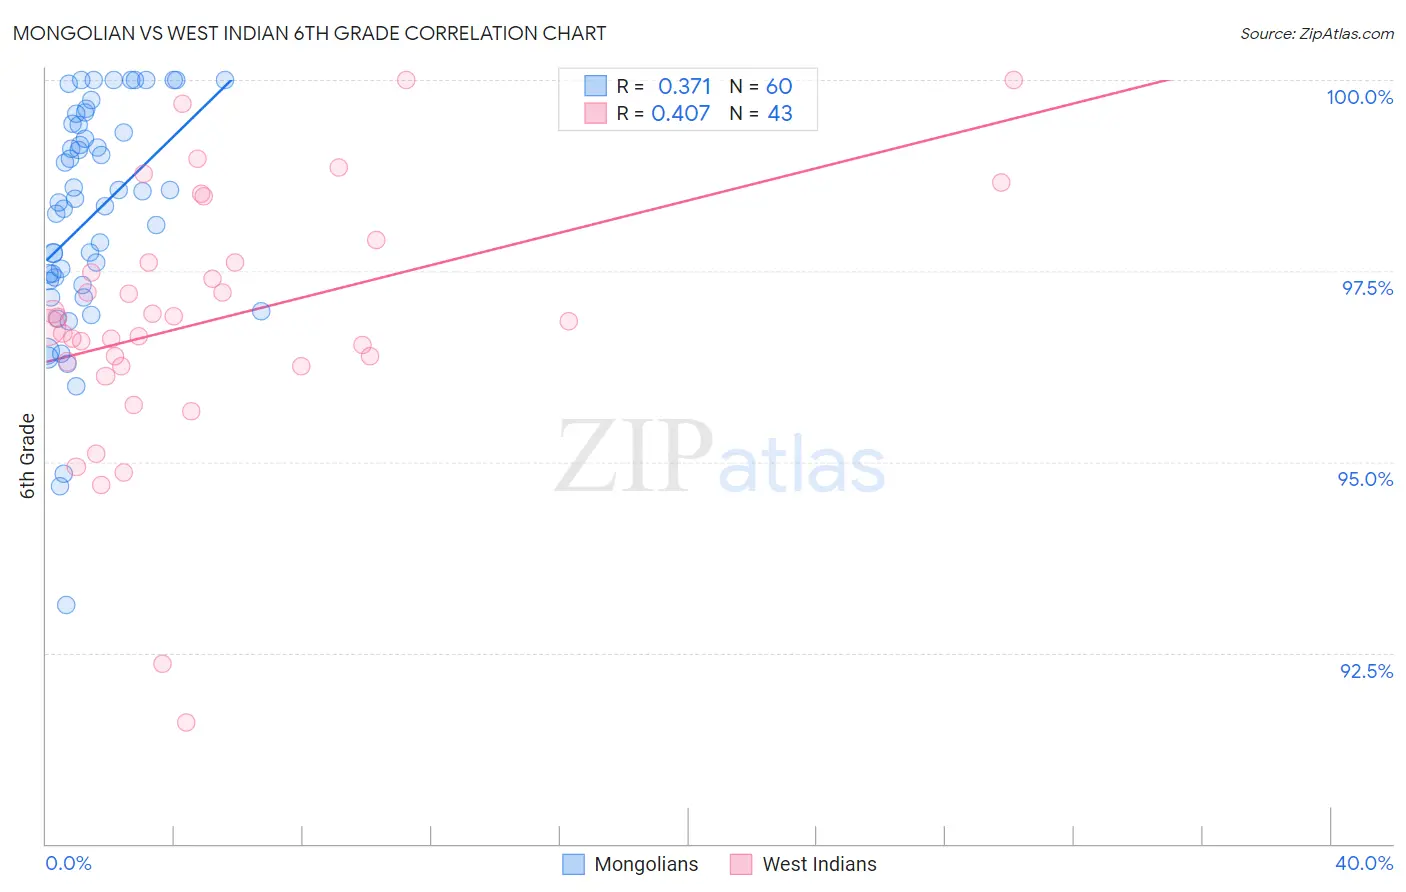
Mongolian vs West Indian 6th Grade Correlation Chart
The statistical analysis conducted on geographies consisting of 140,315,038 people shows a mild positive correlation between the proportion of Mongolians and percentage of population with at least 6th grade education in the United States with a correlation coefficient (R) of 0.371 and weighted average of 97.0%. Similarly, the statistical analysis conducted on geographies consisting of 254,059,006 people shows a moderate positive correlation between the proportion of West Indians and percentage of population with at least 6th grade education in the United States with a correlation coefficient (R) of 0.407 and weighted average of 96.3%, a difference of 0.72%.
6th Grade Correlation Summary
| Measurement | Mongolian | West Indian |
| Minimum | 93.1% | 91.6% |
| Maximum | 100.0% | 100.0% |
| Range | 6.9% | 8.4% |
| Mean | 98.2% | 96.9% |
| Median | 98.4% | 96.8% |
| Interquartile 25% (IQ1) | 97.3% | 96.3% |
| Interquartile 75% (IQ3) | 99.4% | 97.6% |
| Interquartile Range (IQR) | 2.1% | 1.4% |
| Standard Deviation (Sample) | 1.5% | 1.7% |
| Standard Deviation (Population) | 1.5% | 1.7% |
Similar Demographics by 6th Grade
Demographics Similar to Mongolians by 6th Grade
In terms of 6th grade, the demographic groups most similar to Mongolians are Immigrants from Kazakhstan (97.0%, a difference of 0.0%), Immigrants from Micronesia (97.0%, a difference of 0.0%), Pakistani (97.0%, a difference of 0.0%), Venezuelan (97.0%, a difference of 0.010%), and Immigrants from Kenya (97.0%, a difference of 0.010%).
| Demographics | Rating | Rank | 6th Grade |
| Chileans | 52.1 /100 | #170 | Average 97.1% |
| Immigrants | Sri Lanka | 51.7 /100 | #171 | Average 97.1% |
| Egyptians | 50.9 /100 | #172 | Average 97.1% |
| Arabs | 50.1 /100 | #173 | Average 97.0% |
| Venezuelans | 50.0 /100 | #174 | Average 97.0% |
| Immigrants | Kazakhstan | 47.3 /100 | #175 | Average 97.0% |
| Immigrants | Micronesia | 47.1 /100 | #176 | Average 97.0% |
| Mongolians | 46.7 /100 | #177 | Average 97.0% |
| Pakistanis | 46.0 /100 | #178 | Average 97.0% |
| Immigrants | Kenya | 45.3 /100 | #179 | Average 97.0% |
| Immigrants | Spain | 39.9 /100 | #180 | Fair 97.0% |
| Comanche | 37.9 /100 | #181 | Fair 97.0% |
| Immigrants | Ukraine | 35.6 /100 | #182 | Fair 97.0% |
| Immigrants | Venezuela | 34.5 /100 | #183 | Fair 97.0% |
| Spanish Americans | 33.5 /100 | #184 | Fair 97.0% |
Demographics Similar to West Indians by 6th Grade
In terms of 6th grade, the demographic groups most similar to West Indians are Immigrants from Uzbekistan (96.3%, a difference of 0.0%), Immigrants from South America (96.3%, a difference of 0.0%), Immigrants from Hong Kong (96.3%, a difference of 0.010%), Ghanaian (96.4%, a difference of 0.030%), and Afghan (96.4%, a difference of 0.030%).
| Demographics | Rating | Rank | 6th Grade |
| Immigrants | Nigeria | 0.3 /100 | #262 | Tragic 96.4% |
| Immigrants | Colombia | 0.3 /100 | #263 | Tragic 96.4% |
| Armenians | 0.3 /100 | #264 | Tragic 96.4% |
| Immigrants | Jamaica | 0.2 /100 | #265 | Tragic 96.4% |
| Ghanaians | 0.2 /100 | #266 | Tragic 96.4% |
| Afghans | 0.2 /100 | #267 | Tragic 96.4% |
| Immigrants | Uzbekistan | 0.2 /100 | #268 | Tragic 96.3% |
| West Indians | 0.2 /100 | #269 | Tragic 96.3% |
| Immigrants | South America | 0.2 /100 | #270 | Tragic 96.3% |
| Immigrants | Hong Kong | 0.2 /100 | #271 | Tragic 96.3% |
| Immigrants | Bolivia | 0.1 /100 | #272 | Tragic 96.3% |
| Immigrants | Cameroon | 0.1 /100 | #273 | Tragic 96.3% |
| Immigrants | Philippines | 0.1 /100 | #274 | Tragic 96.3% |
| Immigrants | Ghana | 0.1 /100 | #275 | Tragic 96.3% |
| Yaqui | 0.1 /100 | #276 | Tragic 96.3% |