Luxembourger vs West Indian Single Father Poverty
COMPARE
Luxembourger
West Indian
Single Father Poverty
Single Father Poverty Comparison
Luxembourgers
West Indians
17.1%
SINGLE FATHER POVERTY
1.1/ 100
METRIC RATING
251st/ 347
METRIC RANK
18.0%
SINGLE FATHER POVERTY
0.0/ 100
METRIC RATING
290th/ 347
METRIC RANK
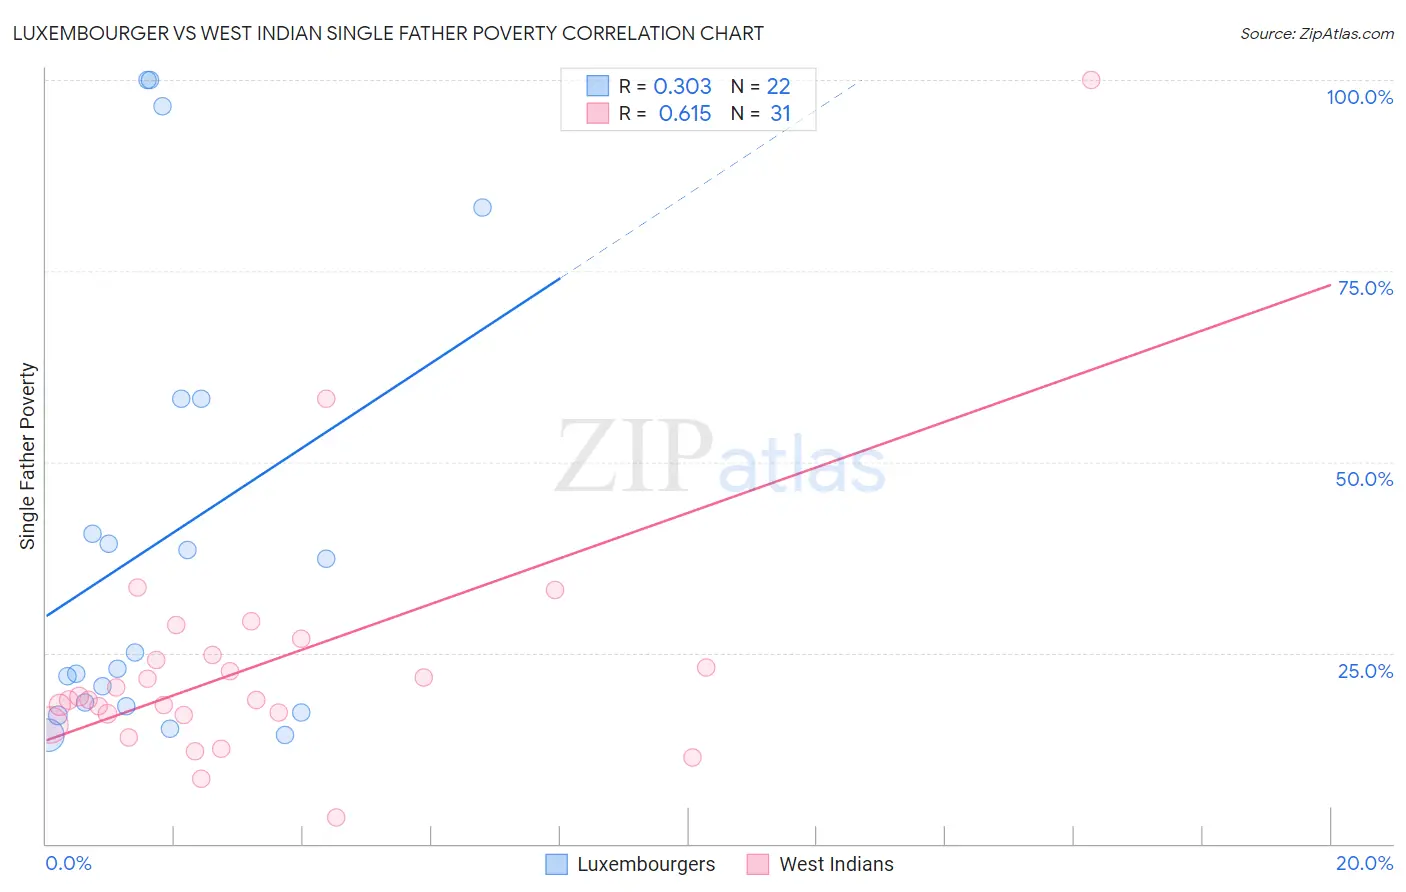
Luxembourger vs West Indian Single Father Poverty Correlation Chart
The statistical analysis conducted on geographies consisting of 123,209,888 people shows a mild positive correlation between the proportion of Luxembourgers and poverty level among single fathers in the United States with a correlation coefficient (R) of 0.303 and weighted average of 17.1%. Similarly, the statistical analysis conducted on geographies consisting of 216,434,953 people shows a significant positive correlation between the proportion of West Indians and poverty level among single fathers in the United States with a correlation coefficient (R) of 0.615 and weighted average of 18.0%, a difference of 5.5%.
Single Father Poverty Correlation Summary
| Measurement | Luxembourger | West Indian |
| Minimum | 14.2% | 3.5% |
| Maximum | 100.0% | 100.0% |
| Range | 85.8% | 96.5% |
| Mean | 40.0% | 23.4% |
| Median | 24.0% | 18.9% |
| Interquartile 25% (IQ1) | 18.0% | 16.8% |
| Interquartile 75% (IQ3) | 58.3% | 24.6% |
| Interquartile Range (IQR) | 40.4% | 7.8% |
| Standard Deviation (Sample) | 29.6% | 17.1% |
| Standard Deviation (Population) | 29.0% | 16.9% |
Similar Demographics by Single Father Poverty
Demographics Similar to Luxembourgers by Single Father Poverty
In terms of single father poverty, the demographic groups most similar to Luxembourgers are Austrian (17.1%, a difference of 0.010%), Croatian (17.1%, a difference of 0.10%), Cree (17.1%, a difference of 0.11%), Canadian (17.1%, a difference of 0.14%), and Greek (17.1%, a difference of 0.18%).
| Demographics | Rating | Rank | Single Father Poverty |
| Hondurans | 1.6 /100 | #244 | Tragic 17.0% |
| Trinidadians and Tobagonians | 1.5 /100 | #245 | Tragic 17.0% |
| Immigrants | Ireland | 1.4 /100 | #246 | Tragic 17.1% |
| Greeks | 1.3 /100 | #247 | Tragic 17.1% |
| Czechoslovakians | 1.3 /100 | #248 | Tragic 17.1% |
| Canadians | 1.3 /100 | #249 | Tragic 17.1% |
| Austrians | 1.1 /100 | #250 | Tragic 17.1% |
| Luxembourgers | 1.1 /100 | #251 | Tragic 17.1% |
| Croatians | 1.0 /100 | #252 | Tragic 17.1% |
| Cree | 1.0 /100 | #253 | Tragic 17.1% |
| Immigrants | Honduras | 0.9 /100 | #254 | Tragic 17.1% |
| Sierra Leoneans | 0.8 /100 | #255 | Tragic 17.2% |
| Immigrants | Haiti | 0.8 /100 | #256 | Tragic 17.2% |
| Immigrants | Albania | 0.7 /100 | #257 | Tragic 17.2% |
| Albanians | 0.7 /100 | #258 | Tragic 17.2% |
Demographics Similar to West Indians by Single Father Poverty
In terms of single father poverty, the demographic groups most similar to West Indians are Irish (18.0%, a difference of 0.030%), Alaskan Athabascan (18.1%, a difference of 0.22%), Immigrants from Bahamas (18.1%, a difference of 0.23%), Alaska Native (18.1%, a difference of 0.34%), and U.S. Virgin Islander (18.1%, a difference of 0.36%).
| Demographics | Rating | Rank | Single Father Poverty |
| Alsatians | 0.0 /100 | #283 | Tragic 17.8% |
| Welsh | 0.0 /100 | #284 | Tragic 17.8% |
| Immigrants | Lebanon | 0.0 /100 | #285 | Tragic 17.9% |
| Immigrants | North Macedonia | 0.0 /100 | #286 | Tragic 17.9% |
| Carpatho Rusyns | 0.0 /100 | #287 | Tragic 18.0% |
| Bahamians | 0.0 /100 | #288 | Tragic 18.0% |
| Irish | 0.0 /100 | #289 | Tragic 18.0% |
| West Indians | 0.0 /100 | #290 | Tragic 18.0% |
| Alaskan Athabascans | 0.0 /100 | #291 | Tragic 18.1% |
| Immigrants | Bahamas | 0.0 /100 | #292 | Tragic 18.1% |
| Alaska Natives | 0.0 /100 | #293 | Tragic 18.1% |
| U.S. Virgin Islanders | 0.0 /100 | #294 | Tragic 18.1% |
| Yakama | 0.0 /100 | #295 | Tragic 18.1% |
| Seminole | 0.0 /100 | #296 | Tragic 18.1% |
| French | 0.0 /100 | #297 | Tragic 18.2% |