British vs West Indian Single Father Poverty
COMPARE
British
West Indian
Single Father Poverty
Single Father Poverty Comparison
British
West Indians
16.8%
SINGLE FATHER POVERTY
5.6/ 100
METRIC RATING
227th/ 347
METRIC RANK
18.0%
SINGLE FATHER POVERTY
0.0/ 100
METRIC RATING
290th/ 347
METRIC RANK
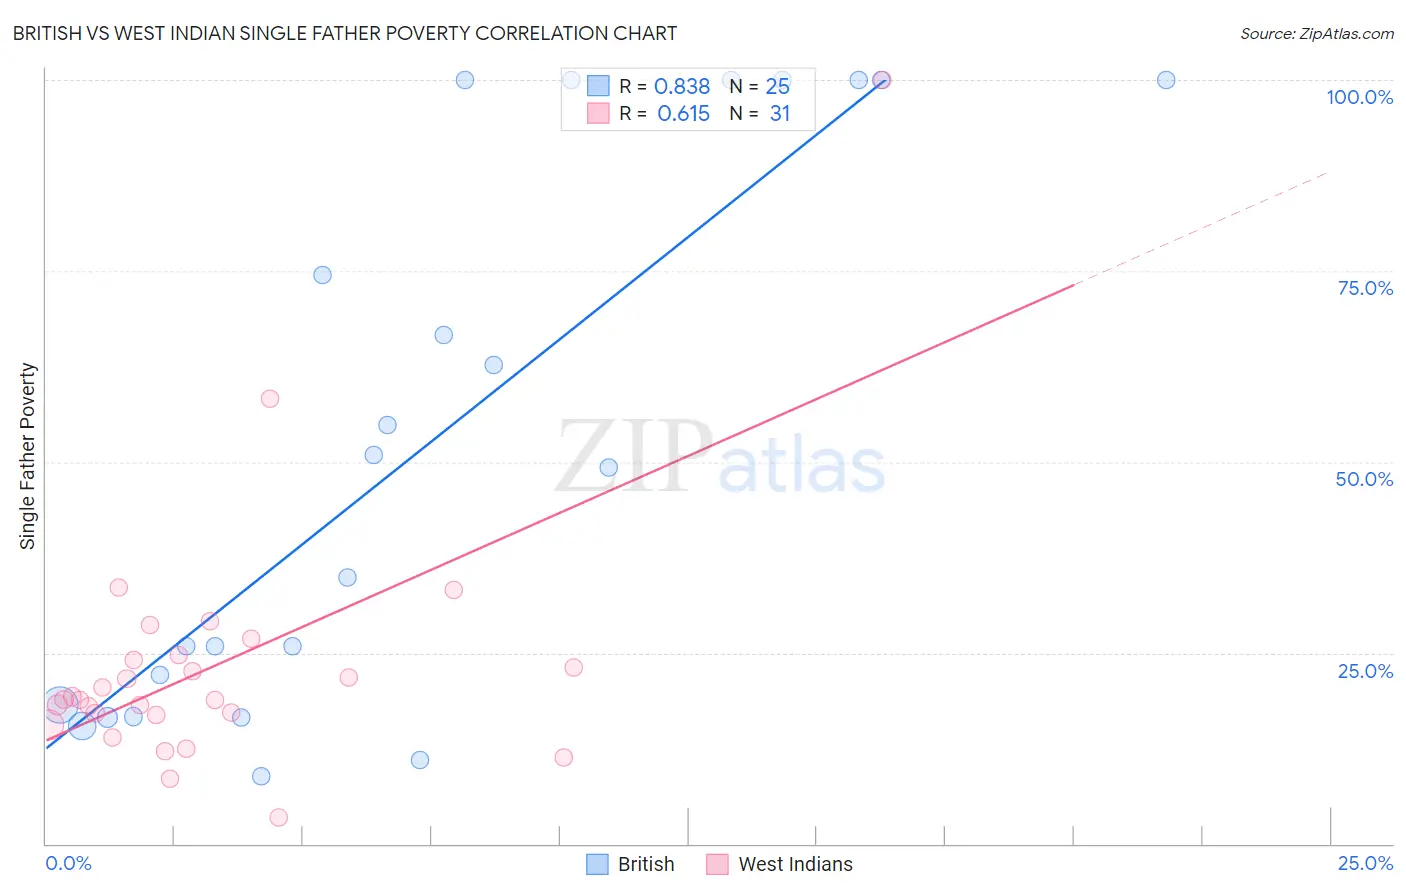
British vs West Indian Single Father Poverty Correlation Chart
The statistical analysis conducted on geographies consisting of 389,691,429 people shows a very strong positive correlation between the proportion of British and poverty level among single fathers in the United States with a correlation coefficient (R) of 0.838 and weighted average of 16.8%. Similarly, the statistical analysis conducted on geographies consisting of 216,434,953 people shows a significant positive correlation between the proportion of West Indians and poverty level among single fathers in the United States with a correlation coefficient (R) of 0.615 and weighted average of 18.0%, a difference of 7.4%.
Single Father Poverty Correlation Summary
| Measurement | British | West Indian |
| Minimum | 8.8% | 3.5% |
| Maximum | 100.0% | 100.0% |
| Range | 91.2% | 96.5% |
| Mean | 51.9% | 23.4% |
| Median | 49.3% | 18.9% |
| Interquartile 25% (IQ1) | 17.4% | 16.8% |
| Interquartile 75% (IQ3) | 100.0% | 24.6% |
| Interquartile Range (IQR) | 82.6% | 7.8% |
| Standard Deviation (Sample) | 35.4% | 17.1% |
| Standard Deviation (Population) | 34.6% | 16.9% |
Similar Demographics by Single Father Poverty
Demographics Similar to British by Single Father Poverty
In terms of single father poverty, the demographic groups most similar to British are Belgian (16.8%, a difference of 0.070%), Hispanic or Latino (16.8%, a difference of 0.10%), Menominee (16.8%, a difference of 0.15%), Immigrants from Norway (16.8%, a difference of 0.16%), and Israeli (16.8%, a difference of 0.22%).
| Demographics | Rating | Rank | Single Father Poverty |
| Immigrants | Denmark | 8.1 /100 | #220 | Tragic 16.7% |
| Immigrants | Greece | 8.1 /100 | #221 | Tragic 16.7% |
| Immigrants | Spain | 8.0 /100 | #222 | Tragic 16.7% |
| Immigrants | Austria | 7.0 /100 | #223 | Tragic 16.8% |
| Immigrants | Norway | 6.5 /100 | #224 | Tragic 16.8% |
| Menominee | 6.4 /100 | #225 | Tragic 16.8% |
| Hispanics or Latinos | 6.1 /100 | #226 | Tragic 16.8% |
| British | 5.6 /100 | #227 | Tragic 16.8% |
| Belgians | 5.3 /100 | #228 | Tragic 16.8% |
| Israelis | 4.6 /100 | #229 | Tragic 16.8% |
| Immigrants | Trinidad and Tobago | 4.5 /100 | #230 | Tragic 16.8% |
| Spanish Americans | 3.7 /100 | #231 | Tragic 16.9% |
| Immigrants | Grenada | 3.7 /100 | #232 | Tragic 16.9% |
| Senegalese | 3.2 /100 | #233 | Tragic 16.9% |
| Marshallese | 3.1 /100 | #234 | Tragic 16.9% |
Demographics Similar to West Indians by Single Father Poverty
In terms of single father poverty, the demographic groups most similar to West Indians are Irish (18.0%, a difference of 0.030%), Alaskan Athabascan (18.1%, a difference of 0.22%), Immigrants from Bahamas (18.1%, a difference of 0.23%), Alaska Native (18.1%, a difference of 0.34%), and U.S. Virgin Islander (18.1%, a difference of 0.36%).
| Demographics | Rating | Rank | Single Father Poverty |
| Alsatians | 0.0 /100 | #283 | Tragic 17.8% |
| Welsh | 0.0 /100 | #284 | Tragic 17.8% |
| Immigrants | Lebanon | 0.0 /100 | #285 | Tragic 17.9% |
| Immigrants | North Macedonia | 0.0 /100 | #286 | Tragic 17.9% |
| Carpatho Rusyns | 0.0 /100 | #287 | Tragic 18.0% |
| Bahamians | 0.0 /100 | #288 | Tragic 18.0% |
| Irish | 0.0 /100 | #289 | Tragic 18.0% |
| West Indians | 0.0 /100 | #290 | Tragic 18.0% |
| Alaskan Athabascans | 0.0 /100 | #291 | Tragic 18.1% |
| Immigrants | Bahamas | 0.0 /100 | #292 | Tragic 18.1% |
| Alaska Natives | 0.0 /100 | #293 | Tragic 18.1% |
| U.S. Virgin Islanders | 0.0 /100 | #294 | Tragic 18.1% |
| Yakama | 0.0 /100 | #295 | Tragic 18.1% |
| Seminole | 0.0 /100 | #296 | Tragic 18.1% |
| French | 0.0 /100 | #297 | Tragic 18.2% |