Mongolian vs Immigrants from China Single Father Poverty
COMPARE
Mongolian
Immigrants from China
Single Father Poverty
Single Father Poverty Comparison
Mongolians
Immigrants from China
15.3%
SINGLE FATHER POVERTY
99.7/ 100
METRIC RATING
70th/ 347
METRIC RANK
14.9%
SINGLE FATHER POVERTY
99.9/ 100
METRIC RATING
47th/ 347
METRIC RANK
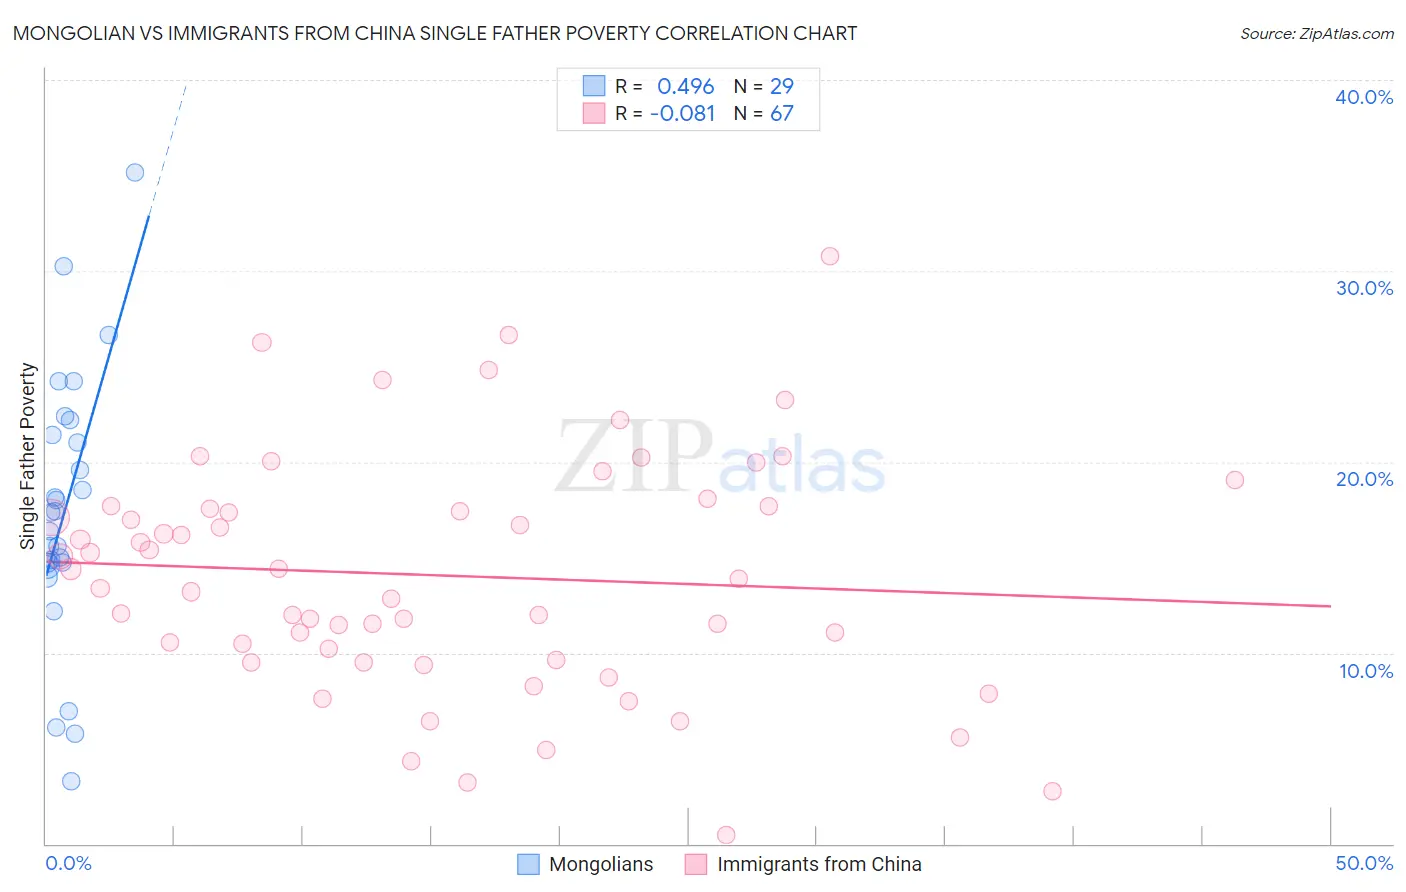
Mongolian vs Immigrants from China Single Father Poverty Correlation Chart
The statistical analysis conducted on geographies consisting of 122,619,201 people shows a moderate positive correlation between the proportion of Mongolians and poverty level among single fathers in the United States with a correlation coefficient (R) of 0.496 and weighted average of 15.3%. Similarly, the statistical analysis conducted on geographies consisting of 348,182,579 people shows a slight negative correlation between the proportion of Immigrants from China and poverty level among single fathers in the United States with a correlation coefficient (R) of -0.081 and weighted average of 14.9%, a difference of 2.1%.
Single Father Poverty Correlation Summary
| Measurement | Mongolian | Immigrants from China |
| Minimum | 3.3% | 0.43% |
| Maximum | 35.2% | 30.8% |
| Range | 31.9% | 30.3% |
| Mean | 17.5% | 14.1% |
| Median | 17.4% | 13.9% |
| Interquartile 25% (IQ1) | 14.6% | 9.6% |
| Interquartile 75% (IQ3) | 21.8% | 17.7% |
| Interquartile Range (IQR) | 7.2% | 8.0% |
| Standard Deviation (Sample) | 7.1% | 6.2% |
| Standard Deviation (Population) | 6.9% | 6.1% |
Similar Demographics by Single Father Poverty
Demographics Similar to Mongolians by Single Father Poverty
In terms of single father poverty, the demographic groups most similar to Mongolians are Japanese (15.2%, a difference of 0.10%), Immigrants from Cameroon (15.2%, a difference of 0.13%), Paraguayan (15.2%, a difference of 0.21%), Immigrants from Brazil (15.3%, a difference of 0.21%), and Immigrants from Moldova (15.2%, a difference of 0.30%).
| Demographics | Rating | Rank | Single Father Poverty |
| Immigrants | Sweden | 99.8 /100 | #63 | Exceptional 15.2% |
| Bangladeshis | 99.8 /100 | #64 | Exceptional 15.2% |
| Immigrants | Malaysia | 99.8 /100 | #65 | Exceptional 15.2% |
| Immigrants | Moldova | 99.8 /100 | #66 | Exceptional 15.2% |
| Paraguayans | 99.7 /100 | #67 | Exceptional 15.2% |
| Immigrants | Cameroon | 99.7 /100 | #68 | Exceptional 15.2% |
| Japanese | 99.7 /100 | #69 | Exceptional 15.2% |
| Mongolians | 99.7 /100 | #70 | Exceptional 15.3% |
| Immigrants | Brazil | 99.6 /100 | #71 | Exceptional 15.3% |
| Immigrants | Lithuania | 99.6 /100 | #72 | Exceptional 15.3% |
| Kenyans | 99.6 /100 | #73 | Exceptional 15.3% |
| Maltese | 99.6 /100 | #74 | Exceptional 15.3% |
| Immigrants | Turkey | 99.5 /100 | #75 | Exceptional 15.3% |
| Immigrants | Japan | 99.5 /100 | #76 | Exceptional 15.3% |
| Immigrants | Peru | 99.5 /100 | #77 | Exceptional 15.3% |
Demographics Similar to Immigrants from China by Single Father Poverty
In terms of single father poverty, the demographic groups most similar to Immigrants from China are Malaysian (14.9%, a difference of 0.010%), Immigrants from Cambodia (14.9%, a difference of 0.030%), Immigrants from Somalia (14.9%, a difference of 0.15%), Immigrants from Eastern Asia (15.0%, a difference of 0.16%), and Bhutanese (15.0%, a difference of 0.21%).
| Demographics | Rating | Rank | Single Father Poverty |
| Pima | 100.0 /100 | #40 | Exceptional 14.8% |
| Indians (Asian) | 100.0 /100 | #41 | Exceptional 14.8% |
| Immigrants | Nepal | 100.0 /100 | #42 | Exceptional 14.8% |
| Immigrants | Eritrea | 100.0 /100 | #43 | Exceptional 14.8% |
| Salvadorans | 100.0 /100 | #44 | Exceptional 14.9% |
| Immigrants | Somalia | 100.0 /100 | #45 | Exceptional 14.9% |
| Immigrants | Cambodia | 99.9 /100 | #46 | Exceptional 14.9% |
| Immigrants | China | 99.9 /100 | #47 | Exceptional 14.9% |
| Malaysians | 99.9 /100 | #48 | Exceptional 14.9% |
| Immigrants | Eastern Asia | 99.9 /100 | #49 | Exceptional 15.0% |
| Bhutanese | 99.9 /100 | #50 | Exceptional 15.0% |
| Immigrants | Pakistan | 99.9 /100 | #51 | Exceptional 15.0% |
| Immigrants | El Salvador | 99.9 /100 | #52 | Exceptional 15.0% |
| Immigrants | Kenya | 99.9 /100 | #53 | Exceptional 15.0% |
| Immigrants | Uzbekistan | 99.9 /100 | #54 | Exceptional 15.0% |