Mongolian vs Indonesian Single Father Poverty
COMPARE
Mongolian
Indonesian
Single Father Poverty
Single Father Poverty Comparison
Mongolians
Indonesians
15.3%
SINGLE FATHER POVERTY
99.7/ 100
METRIC RATING
70th/ 347
METRIC RANK
17.4%
SINGLE FATHER POVERTY
0.2/ 100
METRIC RATING
270th/ 347
METRIC RANK
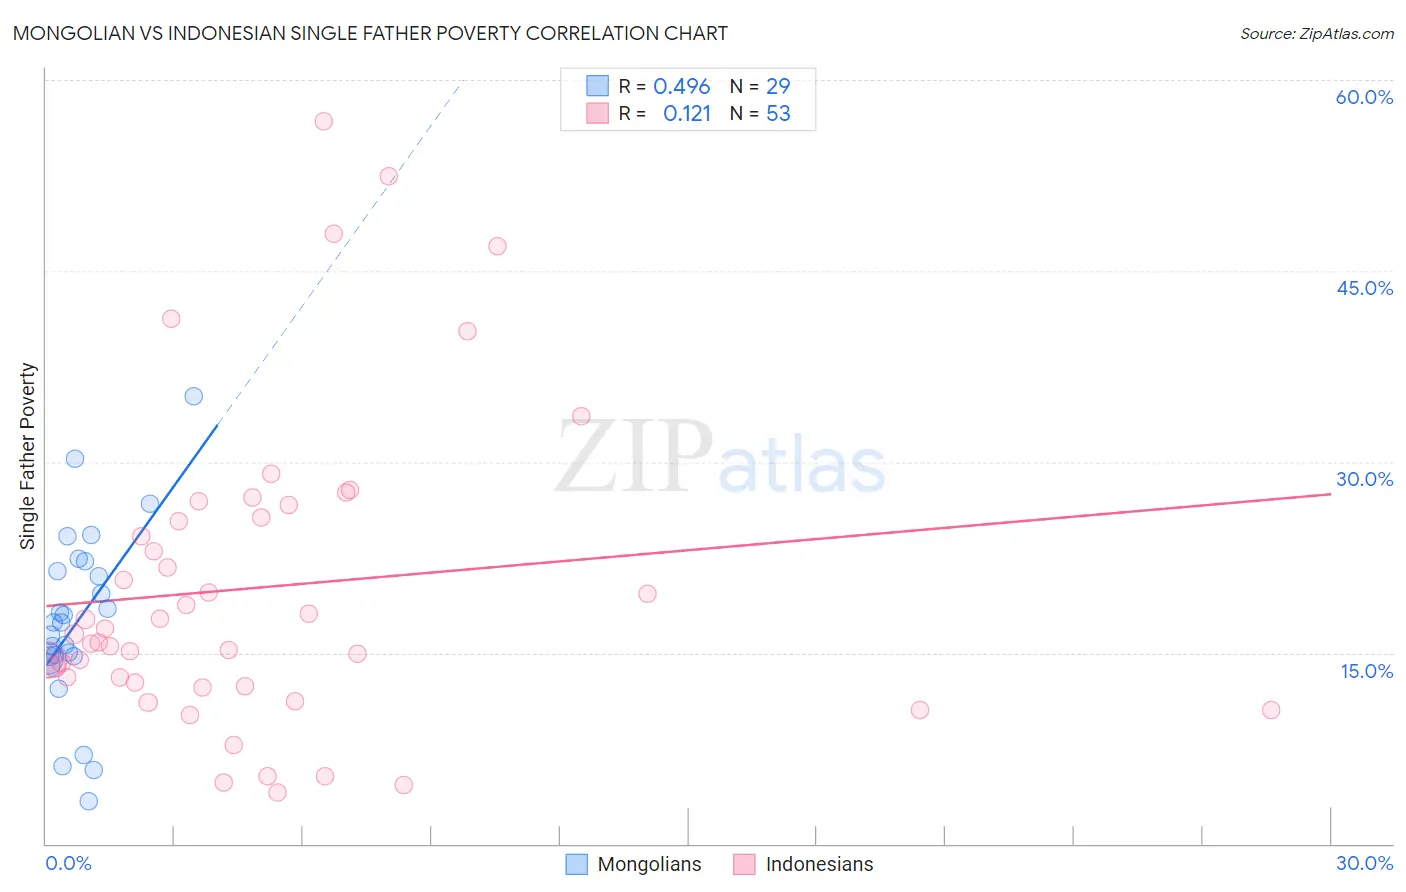
Mongolian vs Indonesian Single Father Poverty Correlation Chart
The statistical analysis conducted on geographies consisting of 122,619,201 people shows a moderate positive correlation between the proportion of Mongolians and poverty level among single fathers in the United States with a correlation coefficient (R) of 0.496 and weighted average of 15.3%. Similarly, the statistical analysis conducted on geographies consisting of 143,522,675 people shows a poor positive correlation between the proportion of Indonesians and poverty level among single fathers in the United States with a correlation coefficient (R) of 0.121 and weighted average of 17.4%, a difference of 14.2%.
Single Father Poverty Correlation Summary
| Measurement | Mongolian | Indonesian |
| Minimum | 3.3% | 4.1% |
| Maximum | 35.2% | 56.8% |
| Range | 31.9% | 52.7% |
| Mean | 17.5% | 20.1% |
| Median | 17.4% | 16.5% |
| Interquartile 25% (IQ1) | 14.6% | 12.5% |
| Interquartile 75% (IQ3) | 21.8% | 26.1% |
| Interquartile Range (IQR) | 7.2% | 13.6% |
| Standard Deviation (Sample) | 7.1% | 12.2% |
| Standard Deviation (Population) | 6.9% | 12.1% |
Similar Demographics by Single Father Poverty
Demographics Similar to Mongolians by Single Father Poverty
In terms of single father poverty, the demographic groups most similar to Mongolians are Japanese (15.2%, a difference of 0.10%), Immigrants from Cameroon (15.2%, a difference of 0.13%), Paraguayan (15.2%, a difference of 0.21%), Immigrants from Brazil (15.3%, a difference of 0.21%), and Immigrants from Moldova (15.2%, a difference of 0.30%).
| Demographics | Rating | Rank | Single Father Poverty |
| Immigrants | Sweden | 99.8 /100 | #63 | Exceptional 15.2% |
| Bangladeshis | 99.8 /100 | #64 | Exceptional 15.2% |
| Immigrants | Malaysia | 99.8 /100 | #65 | Exceptional 15.2% |
| Immigrants | Moldova | 99.8 /100 | #66 | Exceptional 15.2% |
| Paraguayans | 99.7 /100 | #67 | Exceptional 15.2% |
| Immigrants | Cameroon | 99.7 /100 | #68 | Exceptional 15.2% |
| Japanese | 99.7 /100 | #69 | Exceptional 15.2% |
| Mongolians | 99.7 /100 | #70 | Exceptional 15.3% |
| Immigrants | Brazil | 99.6 /100 | #71 | Exceptional 15.3% |
| Immigrants | Lithuania | 99.6 /100 | #72 | Exceptional 15.3% |
| Kenyans | 99.6 /100 | #73 | Exceptional 15.3% |
| Maltese | 99.6 /100 | #74 | Exceptional 15.3% |
| Immigrants | Turkey | 99.5 /100 | #75 | Exceptional 15.3% |
| Immigrants | Japan | 99.5 /100 | #76 | Exceptional 15.3% |
| Immigrants | Peru | 99.5 /100 | #77 | Exceptional 15.3% |
Demographics Similar to Indonesians by Single Father Poverty
In terms of single father poverty, the demographic groups most similar to Indonesians are French American Indian (17.4%, a difference of 0.14%), Slavic (17.4%, a difference of 0.26%), Immigrants from Caribbean (17.4%, a difference of 0.33%), Haitian (17.3%, a difference of 0.43%), and Jamaican (17.3%, a difference of 0.47%).
| Demographics | Rating | Rank | Single Father Poverty |
| Lithuanians | 0.4 /100 | #263 | Tragic 17.3% |
| Slovenes | 0.3 /100 | #264 | Tragic 17.3% |
| Poles | 0.3 /100 | #265 | Tragic 17.3% |
| Jamaicans | 0.3 /100 | #266 | Tragic 17.3% |
| Haitians | 0.3 /100 | #267 | Tragic 17.3% |
| Immigrants | Caribbean | 0.3 /100 | #268 | Tragic 17.4% |
| Slavs | 0.3 /100 | #269 | Tragic 17.4% |
| Indonesians | 0.2 /100 | #270 | Tragic 17.4% |
| French American Indians | 0.2 /100 | #271 | Tragic 17.4% |
| Barbadians | 0.1 /100 | #272 | Tragic 17.5% |
| Italians | 0.1 /100 | #273 | Tragic 17.5% |
| Macedonians | 0.1 /100 | #274 | Tragic 17.7% |
| British West Indians | 0.0 /100 | #275 | Tragic 17.7% |
| German Russians | 0.0 /100 | #276 | Tragic 17.7% |
| Lebanese | 0.0 /100 | #277 | Tragic 17.7% |