Mongolian vs Immigrants from Australia Single Father Poverty
COMPARE
Mongolian
Immigrants from Australia
Single Father Poverty
Single Father Poverty Comparison
Mongolians
Immigrants from Australia
15.3%
SINGLE FATHER POVERTY
99.7/ 100
METRIC RATING
70th/ 347
METRIC RANK
15.7%
SINGLE FATHER POVERTY
96.1/ 100
METRIC RATING
105th/ 347
METRIC RANK
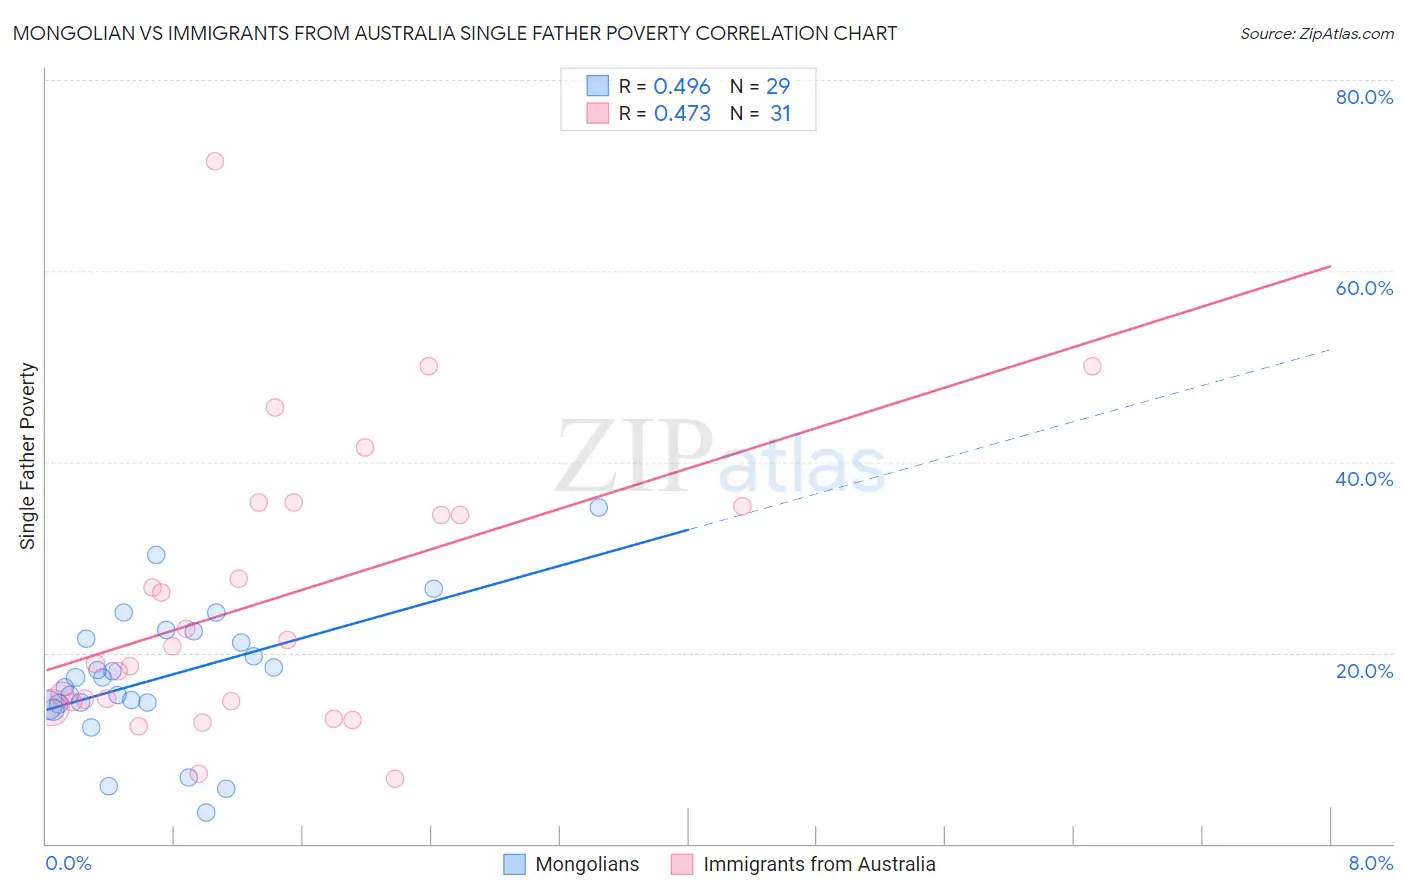
Mongolian vs Immigrants from Australia Single Father Poverty Correlation Chart
The statistical analysis conducted on geographies consisting of 122,619,201 people shows a moderate positive correlation between the proportion of Mongolians and poverty level among single fathers in the United States with a correlation coefficient (R) of 0.496 and weighted average of 15.3%. Similarly, the statistical analysis conducted on geographies consisting of 187,295,963 people shows a moderate positive correlation between the proportion of Immigrants from Australia and poverty level among single fathers in the United States with a correlation coefficient (R) of 0.473 and weighted average of 15.7%, a difference of 3.1%.
Single Father Poverty Correlation Summary
| Measurement | Mongolian | Immigrants from Australia |
| Minimum | 3.3% | 6.8% |
| Maximum | 35.2% | 71.5% |
| Range | 31.9% | 64.7% |
| Mean | 17.5% | 25.5% |
| Median | 17.4% | 20.7% |
| Interquartile 25% (IQ1) | 14.6% | 14.9% |
| Interquartile 75% (IQ3) | 21.8% | 35.3% |
| Interquartile Range (IQR) | 7.2% | 20.4% |
| Standard Deviation (Sample) | 7.1% | 14.9% |
| Standard Deviation (Population) | 6.9% | 14.6% |
Similar Demographics by Single Father Poverty
Demographics Similar to Mongolians by Single Father Poverty
In terms of single father poverty, the demographic groups most similar to Mongolians are Japanese (15.2%, a difference of 0.10%), Immigrants from Cameroon (15.2%, a difference of 0.13%), Paraguayan (15.2%, a difference of 0.21%), Immigrants from Brazil (15.3%, a difference of 0.21%), and Immigrants from Moldova (15.2%, a difference of 0.30%).
| Demographics | Rating | Rank | Single Father Poverty |
| Immigrants | Sweden | 99.8 /100 | #63 | Exceptional 15.2% |
| Bangladeshis | 99.8 /100 | #64 | Exceptional 15.2% |
| Immigrants | Malaysia | 99.8 /100 | #65 | Exceptional 15.2% |
| Immigrants | Moldova | 99.8 /100 | #66 | Exceptional 15.2% |
| Paraguayans | 99.7 /100 | #67 | Exceptional 15.2% |
| Immigrants | Cameroon | 99.7 /100 | #68 | Exceptional 15.2% |
| Japanese | 99.7 /100 | #69 | Exceptional 15.2% |
| Mongolians | 99.7 /100 | #70 | Exceptional 15.3% |
| Immigrants | Brazil | 99.6 /100 | #71 | Exceptional 15.3% |
| Immigrants | Lithuania | 99.6 /100 | #72 | Exceptional 15.3% |
| Kenyans | 99.6 /100 | #73 | Exceptional 15.3% |
| Maltese | 99.6 /100 | #74 | Exceptional 15.3% |
| Immigrants | Turkey | 99.5 /100 | #75 | Exceptional 15.3% |
| Immigrants | Japan | 99.5 /100 | #76 | Exceptional 15.3% |
| Immigrants | Peru | 99.5 /100 | #77 | Exceptional 15.3% |
Demographics Similar to Immigrants from Australia by Single Father Poverty
In terms of single father poverty, the demographic groups most similar to Immigrants from Australia are Australian (15.7%, a difference of 0.010%), South American Indian (15.7%, a difference of 0.030%), Immigrants from Poland (15.7%, a difference of 0.070%), Native Hawaiian (15.7%, a difference of 0.090%), and Chilean (15.7%, a difference of 0.10%).
| Demographics | Rating | Rank | Single Father Poverty |
| Zimbabweans | 98.1 /100 | #98 | Exceptional 15.6% |
| Immigrants | Middle Africa | 97.4 /100 | #99 | Exceptional 15.6% |
| Immigrants | Chile | 96.9 /100 | #100 | Exceptional 15.7% |
| Fijians | 96.8 /100 | #101 | Exceptional 15.7% |
| Chileans | 96.4 /100 | #102 | Exceptional 15.7% |
| South American Indians | 96.2 /100 | #103 | Exceptional 15.7% |
| Australians | 96.1 /100 | #104 | Exceptional 15.7% |
| Immigrants | Australia | 96.1 /100 | #105 | Exceptional 15.7% |
| Immigrants | Poland | 95.8 /100 | #106 | Exceptional 15.7% |
| Native Hawaiians | 95.8 /100 | #107 | Exceptional 15.7% |
| Pakistanis | 95.7 /100 | #108 | Exceptional 15.7% |
| Turks | 95.1 /100 | #109 | Exceptional 15.8% |
| Immigrants | Africa | 95.1 /100 | #110 | Exceptional 15.8% |
| Bulgarians | 94.8 /100 | #111 | Exceptional 15.8% |
| Immigrants | Latvia | 94.7 /100 | #112 | Exceptional 15.8% |