Mongolian vs Black/African American Single Father Poverty
COMPARE
Mongolian
Black/African American
Single Father Poverty
Single Father Poverty Comparison
Mongolians
Blacks/African Americans
15.3%
SINGLE FATHER POVERTY
99.7/ 100
METRIC RATING
70th/ 347
METRIC RANK
20.4%
SINGLE FATHER POVERTY
0.0/ 100
METRIC RATING
325th/ 347
METRIC RANK
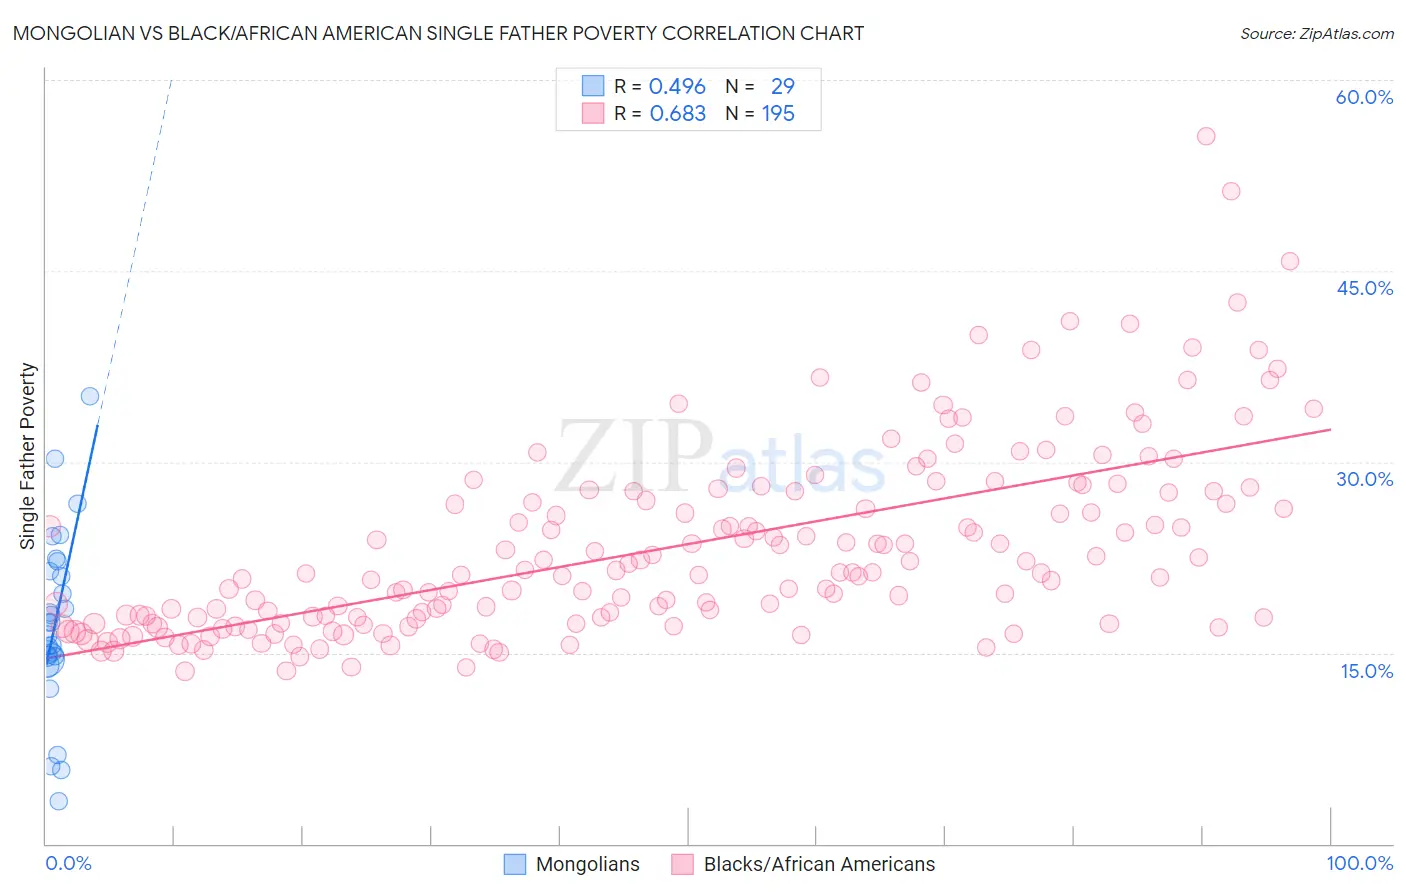
Mongolian vs Black/African American Single Father Poverty Correlation Chart
The statistical analysis conducted on geographies consisting of 122,619,201 people shows a moderate positive correlation between the proportion of Mongolians and poverty level among single fathers in the United States with a correlation coefficient (R) of 0.496 and weighted average of 15.3%. Similarly, the statistical analysis conducted on geographies consisting of 410,273,271 people shows a significant positive correlation between the proportion of Blacks/African Americans and poverty level among single fathers in the United States with a correlation coefficient (R) of 0.683 and weighted average of 20.4%, a difference of 33.6%.
Single Father Poverty Correlation Summary
| Measurement | Mongolian | Black/African American |
| Minimum | 3.3% | 13.5% |
| Maximum | 35.2% | 55.6% |
| Range | 31.9% | 42.1% |
| Mean | 17.5% | 23.3% |
| Median | 17.4% | 21.3% |
| Interquartile 25% (IQ1) | 14.6% | 17.6% |
| Interquartile 75% (IQ3) | 21.8% | 27.7% |
| Interquartile Range (IQR) | 7.2% | 10.1% |
| Standard Deviation (Sample) | 7.1% | 7.4% |
| Standard Deviation (Population) | 6.9% | 7.4% |
Similar Demographics by Single Father Poverty
Demographics Similar to Mongolians by Single Father Poverty
In terms of single father poverty, the demographic groups most similar to Mongolians are Japanese (15.2%, a difference of 0.10%), Immigrants from Cameroon (15.2%, a difference of 0.13%), Paraguayan (15.2%, a difference of 0.21%), Immigrants from Brazil (15.3%, a difference of 0.21%), and Immigrants from Moldova (15.2%, a difference of 0.30%).
| Demographics | Rating | Rank | Single Father Poverty |
| Immigrants | Sweden | 99.8 /100 | #63 | Exceptional 15.2% |
| Bangladeshis | 99.8 /100 | #64 | Exceptional 15.2% |
| Immigrants | Malaysia | 99.8 /100 | #65 | Exceptional 15.2% |
| Immigrants | Moldova | 99.8 /100 | #66 | Exceptional 15.2% |
| Paraguayans | 99.7 /100 | #67 | Exceptional 15.2% |
| Immigrants | Cameroon | 99.7 /100 | #68 | Exceptional 15.2% |
| Japanese | 99.7 /100 | #69 | Exceptional 15.2% |
| Mongolians | 99.7 /100 | #70 | Exceptional 15.3% |
| Immigrants | Brazil | 99.6 /100 | #71 | Exceptional 15.3% |
| Immigrants | Lithuania | 99.6 /100 | #72 | Exceptional 15.3% |
| Kenyans | 99.6 /100 | #73 | Exceptional 15.3% |
| Maltese | 99.6 /100 | #74 | Exceptional 15.3% |
| Immigrants | Turkey | 99.5 /100 | #75 | Exceptional 15.3% |
| Immigrants | Japan | 99.5 /100 | #76 | Exceptional 15.3% |
| Immigrants | Peru | 99.5 /100 | #77 | Exceptional 15.3% |
Demographics Similar to Blacks/African Americans by Single Father Poverty
In terms of single father poverty, the demographic groups most similar to Blacks/African Americans are Immigrants from Yemen (20.6%, a difference of 1.0%), American (20.1%, a difference of 1.6%), Choctaw (20.7%, a difference of 1.7%), Pennsylvania German (20.0%, a difference of 1.8%), and Creek (19.8%, a difference of 2.7%).
| Demographics | Rating | Rank | Single Father Poverty |
| Dutch West Indians | 0.0 /100 | #318 | Tragic 19.2% |
| Slovaks | 0.0 /100 | #319 | Tragic 19.3% |
| Inupiat | 0.0 /100 | #320 | Tragic 19.5% |
| Cherokee | 0.0 /100 | #321 | Tragic 19.6% |
| Creek | 0.0 /100 | #322 | Tragic 19.8% |
| Pennsylvania Germans | 0.0 /100 | #323 | Tragic 20.0% |
| Americans | 0.0 /100 | #324 | Tragic 20.1% |
| Blacks/African Americans | 0.0 /100 | #325 | Tragic 20.4% |
| Immigrants | Yemen | 0.0 /100 | #326 | Tragic 20.6% |
| Choctaw | 0.0 /100 | #327 | Tragic 20.7% |
| Pueblo | 0.0 /100 | #328 | Tragic 21.1% |
| Colville | 0.0 /100 | #329 | Tragic 21.4% |
| Paiute | 0.0 /100 | #330 | Tragic 21.6% |
| Central American Indians | 0.0 /100 | #331 | Tragic 21.7% |
| Tohono O'odham | 0.0 /100 | #332 | Tragic 22.0% |