Immigrants from Central America vs Sioux Single Father Poverty
COMPARE
Immigrants from Central America
Sioux
Single Father Poverty
Single Father Poverty Comparison
Immigrants from Central America
Sioux
16.0%
SINGLE FATHER POVERTY
83.1/ 100
METRIC RATING
143rd/ 347
METRIC RANK
23.9%
SINGLE FATHER POVERTY
0.0/ 100
METRIC RATING
337th/ 347
METRIC RANK
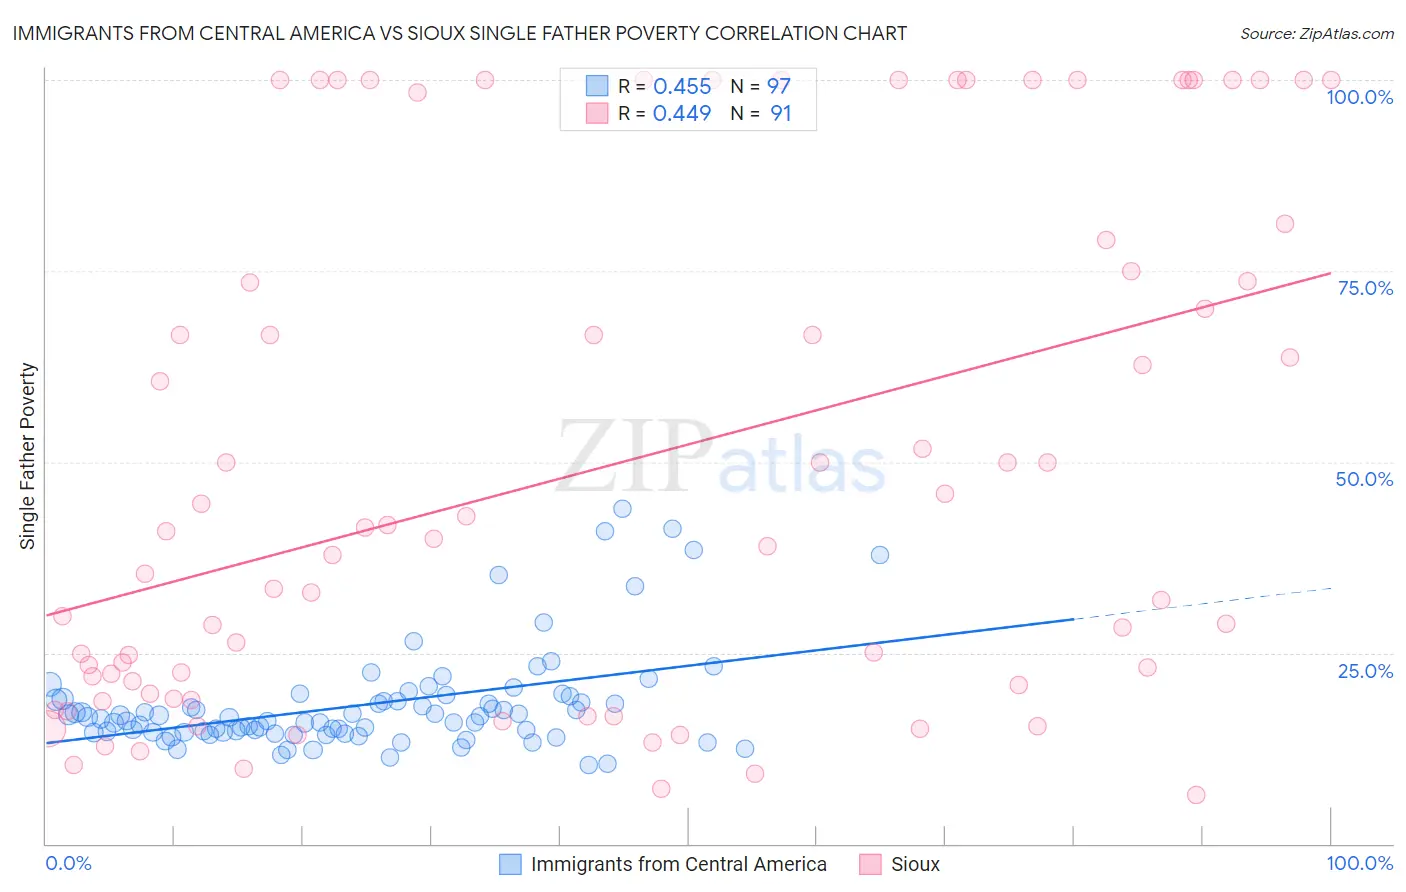
Immigrants from Central America vs Sioux Single Father Poverty Correlation Chart
The statistical analysis conducted on geographies consisting of 395,620,189 people shows a moderate positive correlation between the proportion of Immigrants from Central America and poverty level among single fathers in the United States with a correlation coefficient (R) of 0.455 and weighted average of 16.0%. Similarly, the statistical analysis conducted on geographies consisting of 199,784,577 people shows a moderate positive correlation between the proportion of Sioux and poverty level among single fathers in the United States with a correlation coefficient (R) of 0.449 and weighted average of 23.9%, a difference of 49.2%.
Single Father Poverty Correlation Summary
| Measurement | Immigrants from Central America | Sioux |
| Minimum | 10.4% | 6.4% |
| Maximum | 43.8% | 100.0% |
| Range | 33.4% | 93.6% |
| Mean | 18.2% | 49.3% |
| Median | 16.5% | 40.0% |
| Interquartile 25% (IQ1) | 14.6% | 19.7% |
| Interquartile 75% (IQ3) | 18.9% | 79.0% |
| Interquartile Range (IQR) | 4.3% | 59.4% |
| Standard Deviation (Sample) | 6.7% | 33.2% |
| Standard Deviation (Population) | 6.6% | 33.1% |
Similar Demographics by Single Father Poverty
Demographics Similar to Immigrants from Central America by Single Father Poverty
In terms of single father poverty, the demographic groups most similar to Immigrants from Central America are Liberian (16.0%, a difference of 0.020%), Immigrants from Mexico (16.0%, a difference of 0.020%), Immigrants from Kuwait (16.0%, a difference of 0.13%), Immigrants from Western Asia (16.0%, a difference of 0.18%), and Immigrants from Netherlands (16.0%, a difference of 0.19%).
| Demographics | Rating | Rank | Single Father Poverty |
| Cypriots | 87.5 /100 | #136 | Excellent 15.9% |
| Immigrants | Azores | 87.2 /100 | #137 | Excellent 15.9% |
| Central Americans | 87.1 /100 | #138 | Excellent 16.0% |
| South Americans | 85.9 /100 | #139 | Excellent 16.0% |
| Immigrants | Netherlands | 85.3 /100 | #140 | Excellent 16.0% |
| Liberians | 83.3 /100 | #141 | Excellent 16.0% |
| Immigrants | Mexico | 83.3 /100 | #142 | Excellent 16.0% |
| Immigrants | Central America | 83.1 /100 | #143 | Excellent 16.0% |
| Immigrants | Kuwait | 81.4 /100 | #144 | Excellent 16.0% |
| Immigrants | Western Asia | 80.7 /100 | #145 | Excellent 16.0% |
| Immigrants | Hungary | 78.3 /100 | #146 | Good 16.1% |
| Colombians | 77.1 /100 | #147 | Good 16.1% |
| Nigerians | 76.8 /100 | #148 | Good 16.1% |
| South Africans | 75.1 /100 | #149 | Good 16.1% |
| Jordanians | 74.2 /100 | #150 | Good 16.1% |
Demographics Similar to Sioux by Single Father Poverty
In terms of single father poverty, the demographic groups most similar to Sioux are Arapaho (24.0%, a difference of 0.41%), Apache (24.2%, a difference of 1.5%), Cajun (23.1%, a difference of 3.5%), Shoshone (22.9%, a difference of 4.2%), and Kiowa (22.5%, a difference of 6.3%).
| Demographics | Rating | Rank | Single Father Poverty |
| Paiute | 0.0 /100 | #330 | Tragic 21.6% |
| Central American Indians | 0.0 /100 | #331 | Tragic 21.7% |
| Tohono O'odham | 0.0 /100 | #332 | Tragic 22.0% |
| Natives/Alaskans | 0.0 /100 | #333 | Tragic 22.4% |
| Kiowa | 0.0 /100 | #334 | Tragic 22.5% |
| Shoshone | 0.0 /100 | #335 | Tragic 22.9% |
| Cajuns | 0.0 /100 | #336 | Tragic 23.1% |
| Sioux | 0.0 /100 | #337 | Tragic 23.9% |
| Arapaho | 0.0 /100 | #338 | Tragic 24.0% |
| Apache | 0.0 /100 | #339 | Tragic 24.2% |
| Houma | 0.0 /100 | #340 | Tragic 26.7% |
| Hopi | 0.0 /100 | #341 | Tragic 27.2% |
| Yuman | 0.0 /100 | #342 | Tragic 28.4% |
| Lumbee | 0.0 /100 | #343 | Tragic 28.5% |
| Navajo | 0.0 /100 | #344 | Tragic 29.2% |