Immigrants from Denmark vs Sioux Single Father Poverty
COMPARE
Immigrants from Denmark
Sioux
Single Father Poverty
Single Father Poverty Comparison
Immigrants from Denmark
Sioux
16.7%
SINGLE FATHER POVERTY
8.1/ 100
METRIC RATING
220th/ 347
METRIC RANK
23.9%
SINGLE FATHER POVERTY
0.0/ 100
METRIC RATING
337th/ 347
METRIC RANK
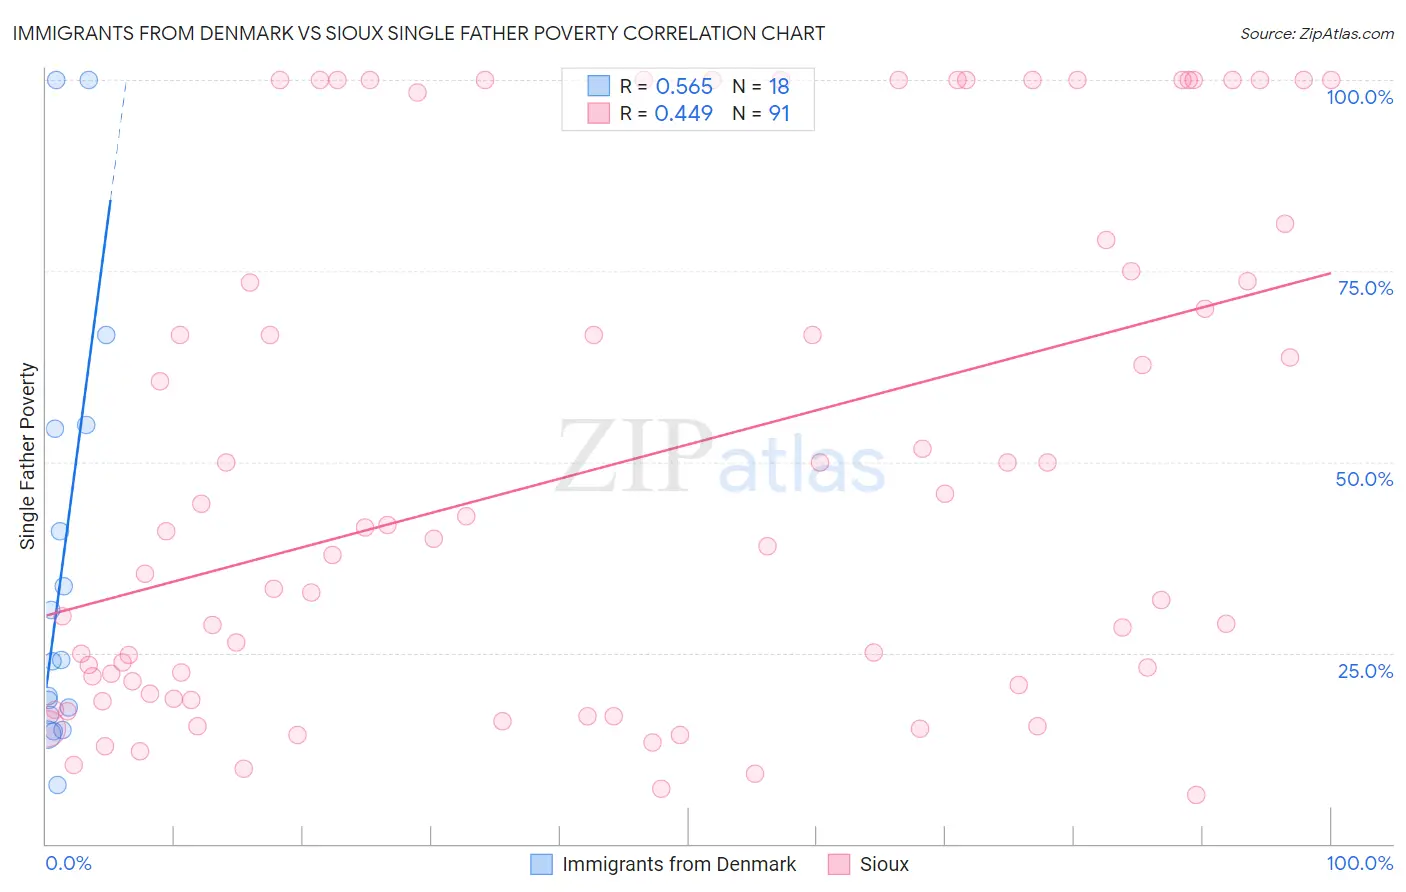
Immigrants from Denmark vs Sioux Single Father Poverty Correlation Chart
The statistical analysis conducted on geographies consisting of 116,977,797 people shows a substantial positive correlation between the proportion of Immigrants from Denmark and poverty level among single fathers in the United States with a correlation coefficient (R) of 0.565 and weighted average of 16.7%. Similarly, the statistical analysis conducted on geographies consisting of 199,784,577 people shows a moderate positive correlation between the proportion of Sioux and poverty level among single fathers in the United States with a correlation coefficient (R) of 0.449 and weighted average of 23.9%, a difference of 42.7%.
Single Father Poverty Correlation Summary
| Measurement | Immigrants from Denmark | Sioux |
| Minimum | 7.7% | 6.4% |
| Maximum | 100.0% | 100.0% |
| Range | 92.3% | 93.6% |
| Mean | 36.3% | 49.3% |
| Median | 24.0% | 40.0% |
| Interquartile 25% (IQ1) | 16.9% | 19.7% |
| Interquartile 75% (IQ3) | 54.3% | 79.0% |
| Interquartile Range (IQR) | 37.4% | 59.4% |
| Standard Deviation (Sample) | 28.3% | 33.2% |
| Standard Deviation (Population) | 27.5% | 33.1% |
Similar Demographics by Single Father Poverty
Demographics Similar to Immigrants from Denmark by Single Father Poverty
In terms of single father poverty, the demographic groups most similar to Immigrants from Denmark are Immigrants from Greece (16.7%, a difference of 0.0%), Immigrants from Ghana (16.7%, a difference of 0.010%), Immigrants from Spain (16.7%, a difference of 0.010%), Immigrants from Uganda (16.7%, a difference of 0.070%), and Cheyenne (16.7%, a difference of 0.17%).
| Demographics | Rating | Rank | Single Father Poverty |
| Ghanaians | 11.0 /100 | #213 | Poor 16.7% |
| Spanish | 10.7 /100 | #214 | Poor 16.7% |
| Immigrants | Scotland | 9.6 /100 | #215 | Tragic 16.7% |
| Immigrants | England | 9.5 /100 | #216 | Tragic 16.7% |
| Cheyenne | 9.3 /100 | #217 | Tragic 16.7% |
| Immigrants | Uganda | 8.6 /100 | #218 | Tragic 16.7% |
| Immigrants | Ghana | 8.1 /100 | #219 | Tragic 16.7% |
| Immigrants | Denmark | 8.1 /100 | #220 | Tragic 16.7% |
| Immigrants | Greece | 8.1 /100 | #221 | Tragic 16.7% |
| Immigrants | Spain | 8.0 /100 | #222 | Tragic 16.7% |
| Immigrants | Austria | 7.0 /100 | #223 | Tragic 16.8% |
| Immigrants | Norway | 6.5 /100 | #224 | Tragic 16.8% |
| Menominee | 6.4 /100 | #225 | Tragic 16.8% |
| Hispanics or Latinos | 6.1 /100 | #226 | Tragic 16.8% |
| British | 5.6 /100 | #227 | Tragic 16.8% |
Demographics Similar to Sioux by Single Father Poverty
In terms of single father poverty, the demographic groups most similar to Sioux are Arapaho (24.0%, a difference of 0.41%), Apache (24.2%, a difference of 1.5%), Cajun (23.1%, a difference of 3.5%), Shoshone (22.9%, a difference of 4.2%), and Kiowa (22.5%, a difference of 6.3%).
| Demographics | Rating | Rank | Single Father Poverty |
| Paiute | 0.0 /100 | #330 | Tragic 21.6% |
| Central American Indians | 0.0 /100 | #331 | Tragic 21.7% |
| Tohono O'odham | 0.0 /100 | #332 | Tragic 22.0% |
| Natives/Alaskans | 0.0 /100 | #333 | Tragic 22.4% |
| Kiowa | 0.0 /100 | #334 | Tragic 22.5% |
| Shoshone | 0.0 /100 | #335 | Tragic 22.9% |
| Cajuns | 0.0 /100 | #336 | Tragic 23.1% |
| Sioux | 0.0 /100 | #337 | Tragic 23.9% |
| Arapaho | 0.0 /100 | #338 | Tragic 24.0% |
| Apache | 0.0 /100 | #339 | Tragic 24.2% |
| Houma | 0.0 /100 | #340 | Tragic 26.7% |
| Hopi | 0.0 /100 | #341 | Tragic 27.2% |
| Yuman | 0.0 /100 | #342 | Tragic 28.4% |
| Lumbee | 0.0 /100 | #343 | Tragic 28.5% |
| Navajo | 0.0 /100 | #344 | Tragic 29.2% |