New Zealander vs Immigrants from Fiji Single Father Poverty
COMPARE
New Zealander
Immigrants from Fiji
Single Father Poverty
Single Father Poverty Comparison
New Zealanders
Immigrants from Fiji
16.6%
SINGLE FATHER POVERTY
13.7/ 100
METRIC RATING
207th/ 347
METRIC RANK
13.2%
SINGLE FATHER POVERTY
100.0/ 100
METRIC RATING
4th/ 347
METRIC RANK
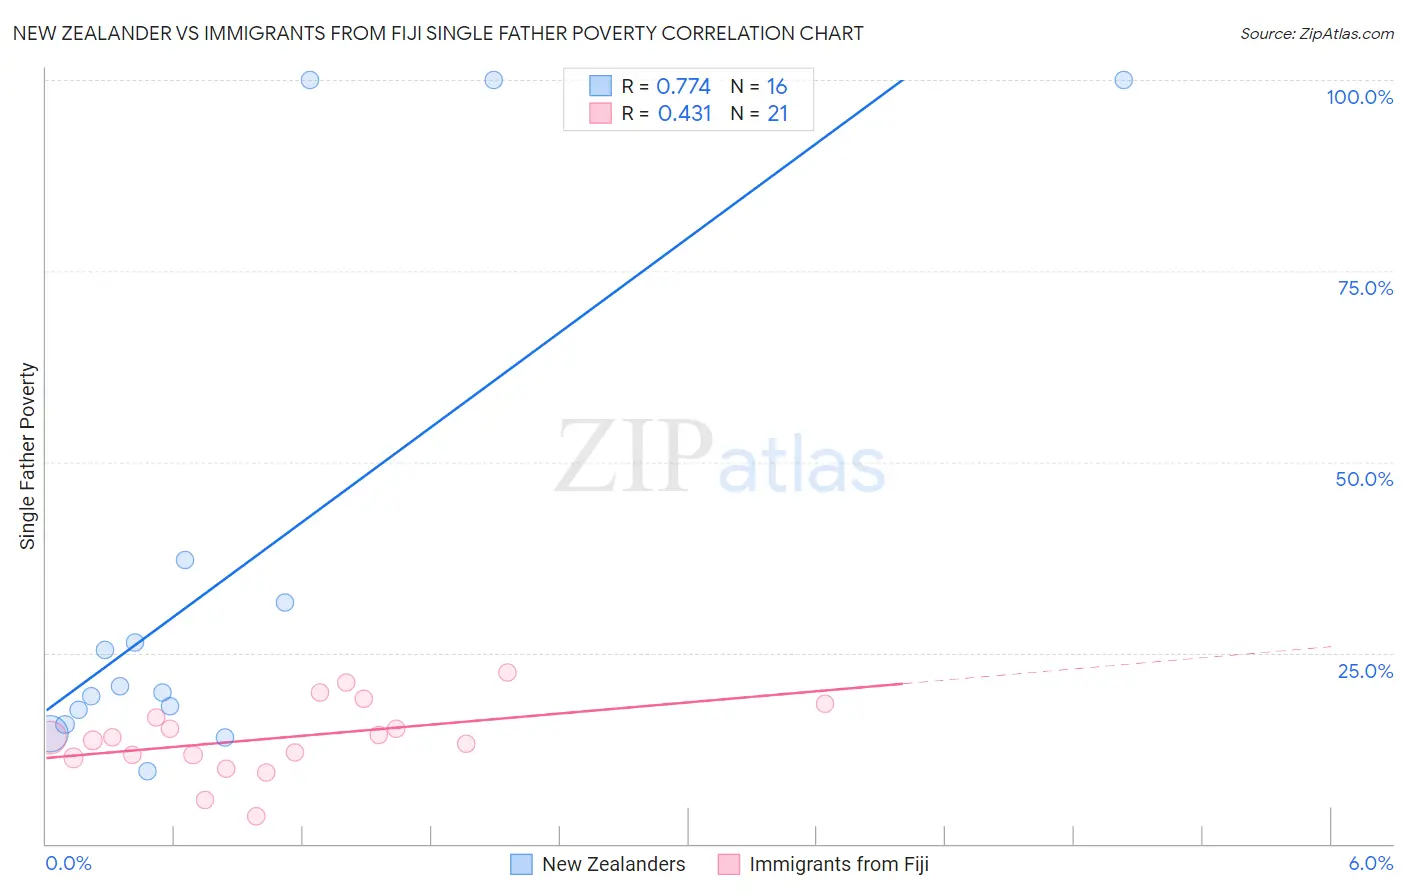
New Zealander vs Immigrants from Fiji Single Father Poverty Correlation Chart
The statistical analysis conducted on geographies consisting of 95,950,950 people shows a strong positive correlation between the proportion of New Zealanders and poverty level among single fathers in the United States with a correlation coefficient (R) of 0.774 and weighted average of 16.6%. Similarly, the statistical analysis conducted on geographies consisting of 85,969,889 people shows a moderate positive correlation between the proportion of Immigrants from Fiji and poverty level among single fathers in the United States with a correlation coefficient (R) of 0.431 and weighted average of 13.2%, a difference of 25.6%.
Single Father Poverty Correlation Summary
| Measurement | New Zealander | Immigrants from Fiji |
| Minimum | 9.5% | 3.7% |
| Maximum | 100.0% | 22.5% |
| Range | 90.5% | 18.8% |
| Mean | 35.6% | 13.9% |
| Median | 20.2% | 13.9% |
| Interquartile 25% (IQ1) | 16.6% | 11.4% |
| Interquartile 75% (IQ3) | 34.4% | 17.4% |
| Interquartile Range (IQR) | 17.8% | 6.0% |
| Standard Deviation (Sample) | 32.7% | 4.7% |
| Standard Deviation (Population) | 31.7% | 4.6% |
Similar Demographics by Single Father Poverty
Demographics Similar to New Zealanders by Single Father Poverty
In terms of single father poverty, the demographic groups most similar to New Zealanders are Immigrants from Senegal (16.6%, a difference of 0.0%), Eastern European (16.6%, a difference of 0.0%), European (16.6%, a difference of 0.040%), Venezuelan (16.6%, a difference of 0.050%), and Guatemalan (16.6%, a difference of 0.070%).
| Demographics | Rating | Rank | Single Father Poverty |
| Syrians | 17.4 /100 | #200 | Poor 16.6% |
| Cubans | 16.5 /100 | #201 | Poor 16.6% |
| Immigrants | Croatia | 16.5 /100 | #202 | Poor 16.6% |
| Immigrants | North America | 15.1 /100 | #203 | Poor 16.6% |
| Immigrants | Guatemala | 14.8 /100 | #204 | Poor 16.6% |
| Venezuelans | 14.3 /100 | #205 | Poor 16.6% |
| Immigrants | Senegal | 13.7 /100 | #206 | Poor 16.6% |
| New Zealanders | 13.7 /100 | #207 | Poor 16.6% |
| Eastern Europeans | 13.7 /100 | #208 | Poor 16.6% |
| Europeans | 13.2 /100 | #209 | Poor 16.6% |
| Guatemalans | 12.9 /100 | #210 | Poor 16.6% |
| Arabs | 12.8 /100 | #211 | Poor 16.6% |
| Immigrants | Southern Europe | 11.2 /100 | #212 | Poor 16.7% |
| Ghanaians | 11.0 /100 | #213 | Poor 16.7% |
| Spanish | 10.7 /100 | #214 | Poor 16.7% |
Demographics Similar to Immigrants from Fiji by Single Father Poverty
In terms of single father poverty, the demographic groups most similar to Immigrants from Fiji are Immigrants from Ethiopia (13.4%, a difference of 1.6%), Ethiopian (13.5%, a difference of 2.3%), Immigrants from Taiwan (13.7%, a difference of 3.4%), Tsimshian (12.7%, a difference of 4.2%), and Samoan (13.8%, a difference of 4.3%).
| Demographics | Rating | Rank | Single Father Poverty |
| Assyrians/Chaldeans/Syriacs | 100.0 /100 | #1 | Exceptional 11.7% |
| Tongans | 100.0 /100 | #2 | Exceptional 12.2% |
| Tsimshian | 100.0 /100 | #3 | Exceptional 12.7% |
| Immigrants | Fiji | 100.0 /100 | #4 | Exceptional 13.2% |
| Immigrants | Ethiopia | 100.0 /100 | #5 | Exceptional 13.4% |
| Ethiopians | 100.0 /100 | #6 | Exceptional 13.5% |
| Immigrants | Taiwan | 100.0 /100 | #7 | Exceptional 13.7% |
| Samoans | 100.0 /100 | #8 | Exceptional 13.8% |
| Afghans | 100.0 /100 | #9 | Exceptional 14.0% |
| Koreans | 100.0 /100 | #10 | Exceptional 14.0% |
| Filipinos | 100.0 /100 | #11 | Exceptional 14.0% |
| Immigrants | India | 100.0 /100 | #12 | Exceptional 14.0% |
| Immigrants | Philippines | 100.0 /100 | #13 | Exceptional 14.0% |
| Immigrants | Vietnam | 100.0 /100 | #14 | Exceptional 14.1% |
| Sri Lankans | 100.0 /100 | #15 | Exceptional 14.2% |