Mexican vs Immigrants from Kenya Family Poverty
COMPARE
Mexican
Immigrants from Kenya
Family Poverty
Family Poverty Comparison
Mexicans
Immigrants from Kenya
11.8%
FAMILY POVERTY
0.0/ 100
METRIC RATING
305th/ 347
METRIC RANK
9.2%
FAMILY POVERTY
34.0/ 100
METRIC RATING
188th/ 347
METRIC RANK
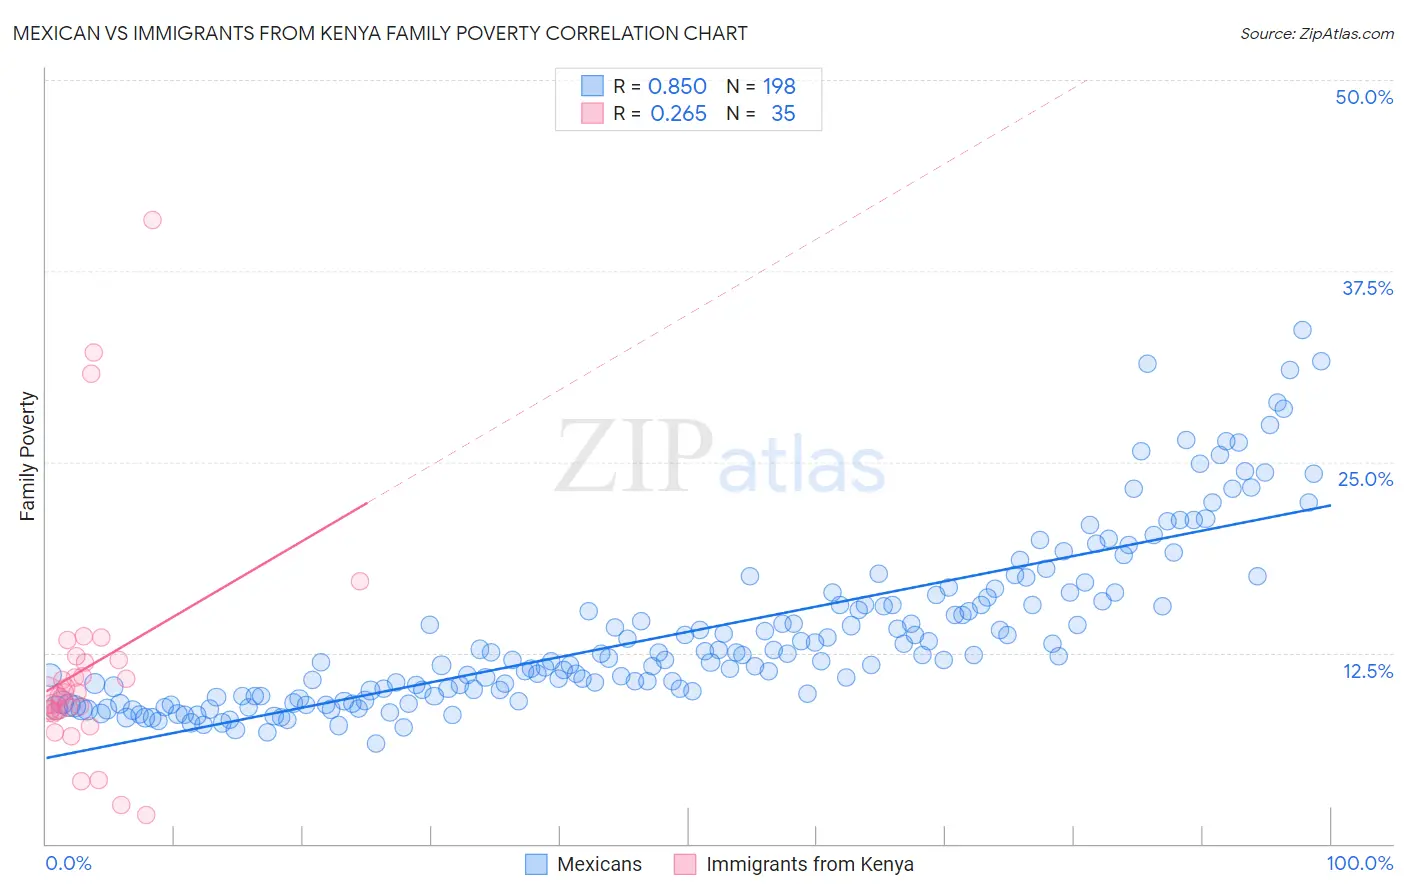
Mexican vs Immigrants from Kenya Family Poverty Correlation Chart
The statistical analysis conducted on geographies consisting of 561,352,455 people shows a very strong positive correlation between the proportion of Mexicans and poverty level among families in the United States with a correlation coefficient (R) of 0.850 and weighted average of 11.8%. Similarly, the statistical analysis conducted on geographies consisting of 217,776,212 people shows a weak positive correlation between the proportion of Immigrants from Kenya and poverty level among families in the United States with a correlation coefficient (R) of 0.265 and weighted average of 9.2%, a difference of 28.4%.
Family Poverty Correlation Summary
| Measurement | Mexican | Immigrants from Kenya |
| Minimum | 6.6% | 1.9% |
| Maximum | 33.6% | 40.8% |
| Range | 27.1% | 39.0% |
| Mean | 13.8% | 11.6% |
| Median | 12.1% | 9.8% |
| Interquartile 25% (IQ1) | 9.7% | 8.7% |
| Interquartile 75% (IQ3) | 15.8% | 12.0% |
| Interquartile Range (IQR) | 6.2% | 3.3% |
| Standard Deviation (Sample) | 5.6% | 7.9% |
| Standard Deviation (Population) | 5.6% | 7.8% |
Similar Demographics by Family Poverty
Demographics Similar to Mexicans by Family Poverty
In terms of family poverty, the demographic groups most similar to Mexicans are Immigrants from Latin America (11.8%, a difference of 0.18%), African (11.8%, a difference of 0.37%), Cajun (11.9%, a difference of 0.56%), Immigrants from Congo (11.9%, a difference of 0.67%), and Seminole (11.9%, a difference of 0.73%).
| Demographics | Rating | Rank | Family Poverty |
| Immigrants | Senegal | 0.0 /100 | #298 | Tragic 11.7% |
| Dutch West Indians | 0.0 /100 | #299 | Tragic 11.7% |
| Immigrants | Bangladesh | 0.0 /100 | #300 | Tragic 11.7% |
| Bahamians | 0.0 /100 | #301 | Tragic 11.7% |
| Guatemalans | 0.0 /100 | #302 | Tragic 11.7% |
| Africans | 0.0 /100 | #303 | Tragic 11.8% |
| Immigrants | Latin America | 0.0 /100 | #304 | Tragic 11.8% |
| Mexicans | 0.0 /100 | #305 | Tragic 11.8% |
| Cajuns | 0.0 /100 | #306 | Tragic 11.9% |
| Immigrants | Congo | 0.0 /100 | #307 | Tragic 11.9% |
| Seminole | 0.0 /100 | #308 | Tragic 11.9% |
| Hispanics or Latinos | 0.0 /100 | #309 | Tragic 12.0% |
| Immigrants | Guatemala | 0.0 /100 | #310 | Tragic 12.0% |
| Ute | 0.0 /100 | #311 | Tragic 12.1% |
| Immigrants | Central America | 0.0 /100 | #312 | Tragic 12.1% |
Demographics Similar to Immigrants from Kenya by Family Poverty
In terms of family poverty, the demographic groups most similar to Immigrants from Kenya are Delaware (9.2%, a difference of 0.20%), Colombian (9.2%, a difference of 0.29%), Immigrants from Afghanistan (9.2%, a difference of 0.29%), Arab (9.2%, a difference of 0.37%), and Immigrants from Saudi Arabia (9.1%, a difference of 0.63%).
| Demographics | Rating | Rank | Family Poverty |
| Hmong | 40.2 /100 | #181 | Average 9.1% |
| Immigrants | Morocco | 40.2 /100 | #182 | Average 9.1% |
| Uruguayans | 39.2 /100 | #183 | Fair 9.1% |
| South American Indians | 38.7 /100 | #184 | Fair 9.1% |
| Immigrants | Saudi Arabia | 38.6 /100 | #185 | Fair 9.1% |
| Colombians | 36.1 /100 | #186 | Fair 9.2% |
| Delaware | 35.4 /100 | #187 | Fair 9.2% |
| Immigrants | Kenya | 34.0 /100 | #188 | Fair 9.2% |
| Immigrants | Afghanistan | 32.1 /100 | #189 | Fair 9.2% |
| Arabs | 31.5 /100 | #190 | Fair 9.2% |
| Ugandans | 28.7 /100 | #191 | Fair 9.3% |
| Spanish | 28.7 /100 | #192 | Fair 9.3% |
| Immigrants | Western Asia | 28.2 /100 | #193 | Fair 9.3% |
| South Americans | 28.1 /100 | #194 | Fair 9.3% |
| Venezuelans | 27.4 /100 | #195 | Fair 9.3% |