Menominee vs Immigrants from Greece Female Poverty Among 25-34 Year Olds
COMPARE
Menominee
Immigrants from Greece
Female Poverty Among 25-34 Year Olds
Female Poverty Among 25-34 Year Olds Comparison
Menominee
Immigrants from Greece
18.0%
FEMALE POVERTY AMONG 25-34 YEAR OLDS
0.0/ 100
METRIC RATING
319th/ 347
METRIC RANK
11.5%
FEMALE POVERTY AMONG 25-34 YEAR OLDS
99.9/ 100
METRIC RATING
27th/ 347
METRIC RANK
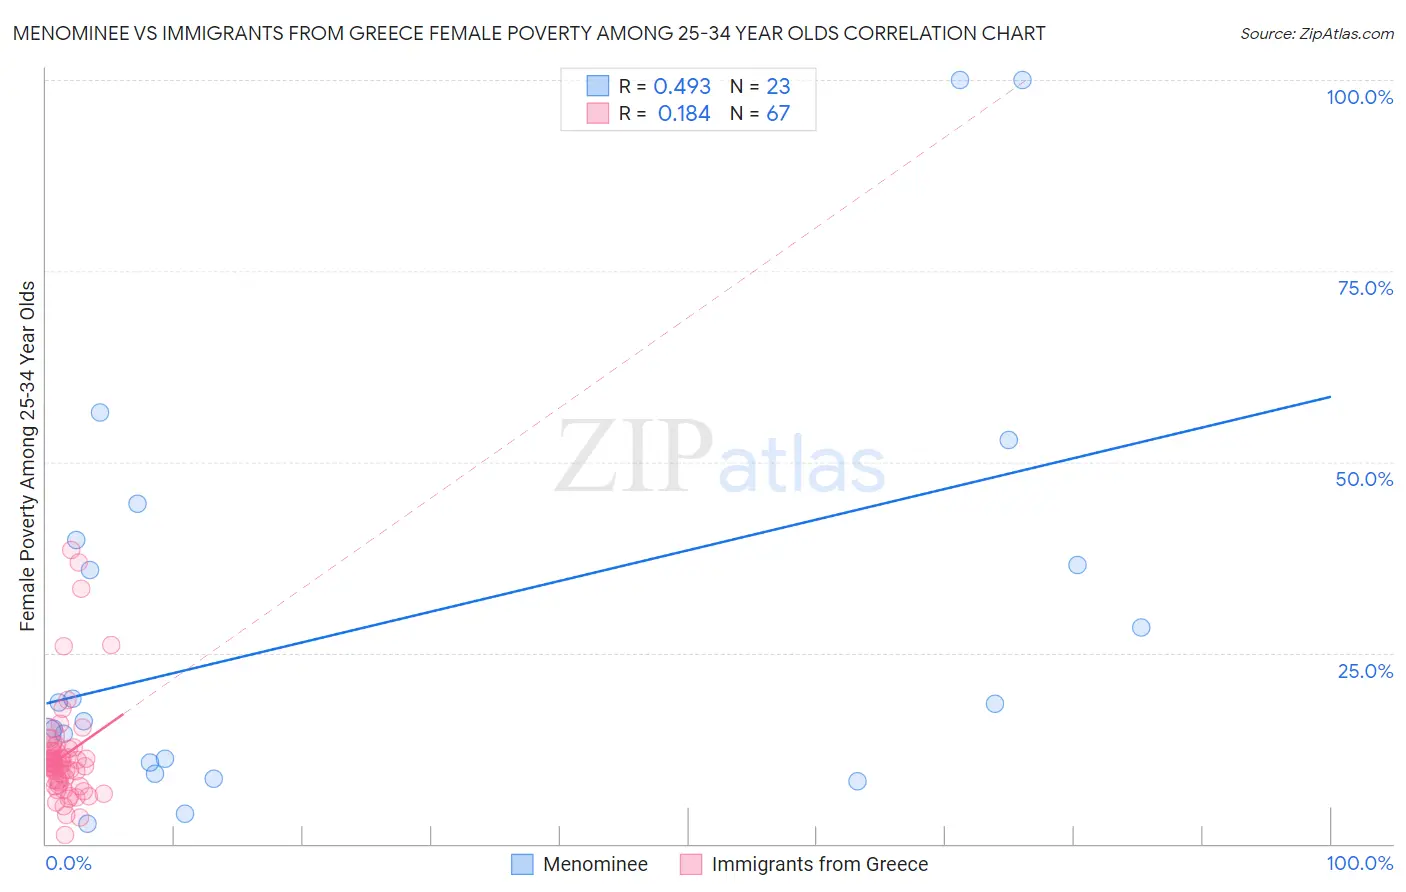
Menominee vs Immigrants from Greece Female Poverty Among 25-34 Year Olds Correlation Chart
The statistical analysis conducted on geographies consisting of 45,599,400 people shows a moderate positive correlation between the proportion of Menominee and poverty level among females between the ages 25 and 34 in the United States with a correlation coefficient (R) of 0.493 and weighted average of 18.0%. Similarly, the statistical analysis conducted on geographies consisting of 213,891,857 people shows a poor positive correlation between the proportion of Immigrants from Greece and poverty level among females between the ages 25 and 34 in the United States with a correlation coefficient (R) of 0.184 and weighted average of 11.5%, a difference of 56.3%.
Female Poverty Among 25-34 Year Olds Correlation Summary
| Measurement | Menominee | Immigrants from Greece |
| Minimum | 2.7% | 1.1% |
| Maximum | 100.0% | 38.5% |
| Range | 97.3% | 37.4% |
| Mean | 28.9% | 11.5% |
| Median | 18.4% | 10.5% |
| Interquartile 25% (IQ1) | 10.6% | 8.1% |
| Interquartile 75% (IQ3) | 39.8% | 12.1% |
| Interquartile Range (IQR) | 29.2% | 4.0% |
| Standard Deviation (Sample) | 27.1% | 6.8% |
| Standard Deviation (Population) | 26.5% | 6.8% |
Similar Demographics by Female Poverty Among 25-34 Year Olds
Demographics Similar to Menominee by Female Poverty Among 25-34 Year Olds
In terms of female poverty among 25-34 year olds, the demographic groups most similar to Menominee are Chippewa (18.0%, a difference of 0.26%), Choctaw (18.1%, a difference of 0.47%), Ute (17.9%, a difference of 0.55%), Arapaho (17.8%, a difference of 1.1%), and Central American Indian (18.2%, a difference of 1.3%).
| Demographics | Rating | Rank | Female Poverty Among 25-34 Year Olds |
| Iroquois | 0.0 /100 | #312 | Tragic 17.5% |
| Colville | 0.0 /100 | #313 | Tragic 17.5% |
| Immigrants | Dominican Republic | 0.0 /100 | #314 | Tragic 17.6% |
| Yakama | 0.0 /100 | #315 | Tragic 17.6% |
| Dominicans | 0.0 /100 | #316 | Tragic 17.6% |
| Arapaho | 0.0 /100 | #317 | Tragic 17.8% |
| Ute | 0.0 /100 | #318 | Tragic 17.9% |
| Menominee | 0.0 /100 | #319 | Tragic 18.0% |
| Chippewa | 0.0 /100 | #320 | Tragic 18.0% |
| Choctaw | 0.0 /100 | #321 | Tragic 18.1% |
| Central American Indians | 0.0 /100 | #322 | Tragic 18.2% |
| Seminole | 0.0 /100 | #323 | Tragic 18.3% |
| Dutch West Indians | 0.0 /100 | #324 | Tragic 18.4% |
| Inupiat | 0.0 /100 | #325 | Tragic 18.5% |
| Blacks/African Americans | 0.0 /100 | #326 | Tragic 18.9% |
Demographics Similar to Immigrants from Greece by Female Poverty Among 25-34 Year Olds
In terms of female poverty among 25-34 year olds, the demographic groups most similar to Immigrants from Greece are Immigrants from Pakistan (11.5%, a difference of 0.24%), Bulgarian (11.5%, a difference of 0.24%), Cypriot (11.5%, a difference of 0.26%), Tongan (11.5%, a difference of 0.30%), and Bhutanese (11.4%, a difference of 0.45%).
| Demographics | Rating | Rank | Female Poverty Among 25-34 Year Olds |
| Okinawans | 100.0 /100 | #20 | Exceptional 11.3% |
| Turks | 100.0 /100 | #21 | Exceptional 11.4% |
| Asians | 99.9 /100 | #22 | Exceptional 11.4% |
| Bolivians | 99.9 /100 | #23 | Exceptional 11.4% |
| Maltese | 99.9 /100 | #24 | Exceptional 11.4% |
| Bhutanese | 99.9 /100 | #25 | Exceptional 11.4% |
| Tongans | 99.9 /100 | #26 | Exceptional 11.5% |
| Immigrants | Greece | 99.9 /100 | #27 | Exceptional 11.5% |
| Immigrants | Pakistan | 99.9 /100 | #28 | Exceptional 11.5% |
| Bulgarians | 99.9 /100 | #29 | Exceptional 11.5% |
| Cypriots | 99.9 /100 | #30 | Exceptional 11.5% |
| Immigrants | Japan | 99.9 /100 | #31 | Exceptional 11.6% |
| Immigrants | Asia | 99.9 /100 | #32 | Exceptional 11.6% |
| Immigrants | Poland | 99.9 /100 | #33 | Exceptional 11.6% |
| Zimbabweans | 99.9 /100 | #34 | Exceptional 11.7% |