Czechoslovakian vs Immigrants from Greece Female Poverty Among 25-34 Year Olds
COMPARE
Czechoslovakian
Immigrants from Greece
Female Poverty Among 25-34 Year Olds
Female Poverty Among 25-34 Year Olds Comparison
Czechoslovakians
Immigrants from Greece
13.7%
FEMALE POVERTY AMONG 25-34 YEAR OLDS
36.8/ 100
METRIC RATING
184th/ 347
METRIC RANK
11.5%
FEMALE POVERTY AMONG 25-34 YEAR OLDS
99.9/ 100
METRIC RATING
27th/ 347
METRIC RANK
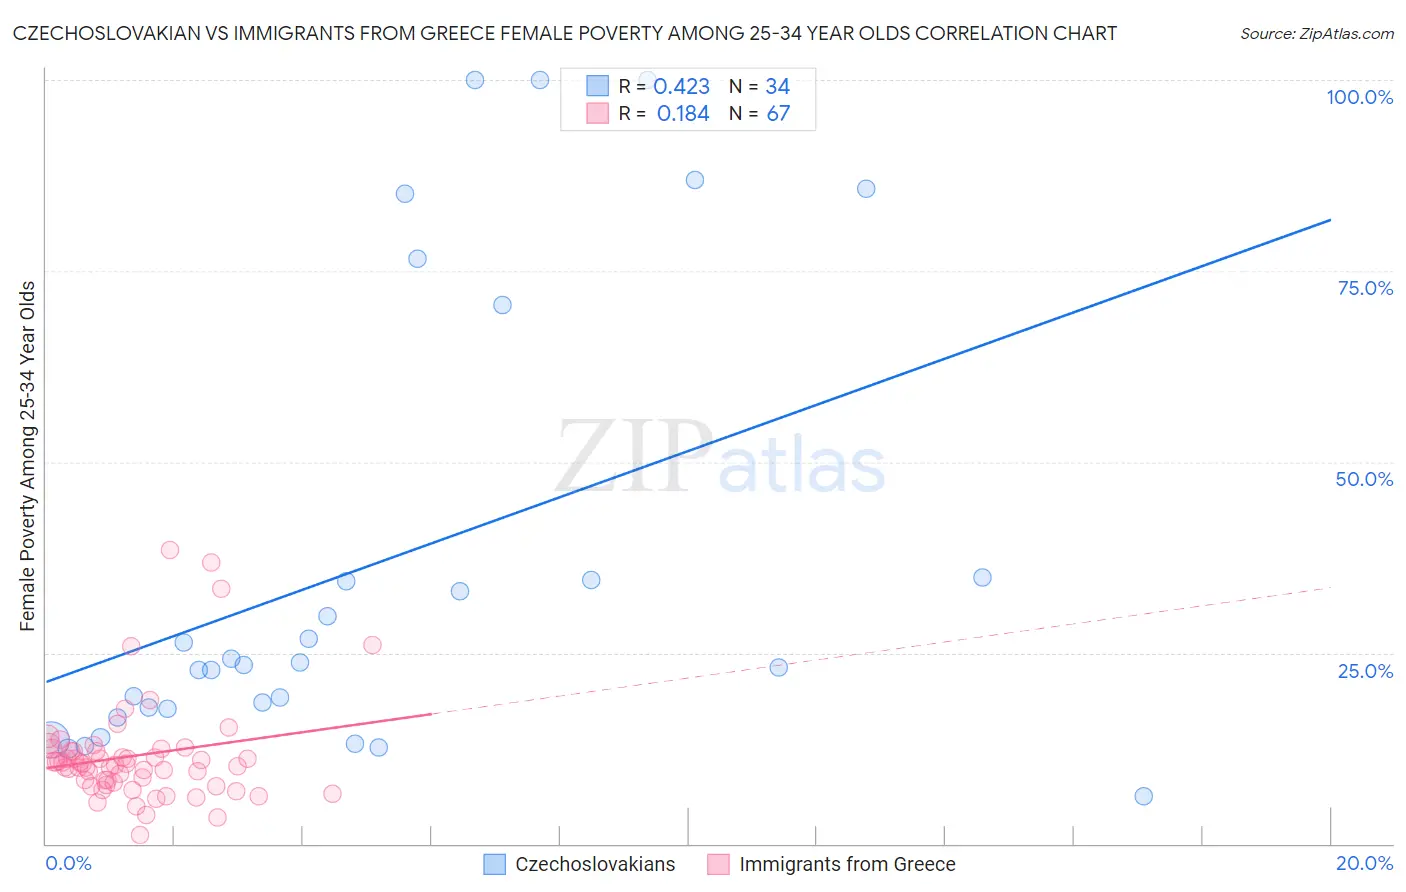
Czechoslovakian vs Immigrants from Greece Female Poverty Among 25-34 Year Olds Correlation Chart
The statistical analysis conducted on geographies consisting of 361,442,854 people shows a moderate positive correlation between the proportion of Czechoslovakians and poverty level among females between the ages 25 and 34 in the United States with a correlation coefficient (R) of 0.423 and weighted average of 13.7%. Similarly, the statistical analysis conducted on geographies consisting of 213,891,857 people shows a poor positive correlation between the proportion of Immigrants from Greece and poverty level among females between the ages 25 and 34 in the United States with a correlation coefficient (R) of 0.184 and weighted average of 11.5%, a difference of 19.0%.
Female Poverty Among 25-34 Year Olds Correlation Summary
| Measurement | Czechoslovakian | Immigrants from Greece |
| Minimum | 6.2% | 1.1% |
| Maximum | 100.0% | 38.5% |
| Range | 93.8% | 37.4% |
| Mean | 37.0% | 11.5% |
| Median | 23.6% | 10.5% |
| Interquartile 25% (IQ1) | 17.7% | 8.1% |
| Interquartile 75% (IQ3) | 34.8% | 12.1% |
| Interquartile Range (IQR) | 17.1% | 4.0% |
| Standard Deviation (Sample) | 30.0% | 6.8% |
| Standard Deviation (Population) | 29.6% | 6.8% |
Similar Demographics by Female Poverty Among 25-34 Year Olds
Demographics Similar to Czechoslovakians by Female Poverty Among 25-34 Year Olds
In terms of female poverty among 25-34 year olds, the demographic groups most similar to Czechoslovakians are Irish (13.7%, a difference of 0.13%), Immigrants from Uruguay (13.7%, a difference of 0.24%), Slovak (13.7%, a difference of 0.24%), Portuguese (13.6%, a difference of 0.31%), and Immigrants from Venezuela (13.6%, a difference of 0.34%).
| Demographics | Rating | Rank | Female Poverty Among 25-34 Year Olds |
| Venezuelans | 44.6 /100 | #177 | Average 13.6% |
| Canadians | 44.3 /100 | #178 | Average 13.6% |
| Immigrants | Eastern Africa | 43.6 /100 | #179 | Average 13.6% |
| Germans | 41.6 /100 | #180 | Average 13.6% |
| Guamanians/Chamorros | 41.5 /100 | #181 | Average 13.6% |
| Immigrants | Venezuela | 40.7 /100 | #182 | Average 13.6% |
| Portuguese | 40.3 /100 | #183 | Average 13.6% |
| Czechoslovakians | 36.8 /100 | #184 | Fair 13.7% |
| Irish | 35.3 /100 | #185 | Fair 13.7% |
| Immigrants | Uruguay | 34.1 /100 | #186 | Fair 13.7% |
| Slovaks | 34.1 /100 | #187 | Fair 13.7% |
| Immigrants | Eritrea | 32.7 /100 | #188 | Fair 13.7% |
| Finns | 32.5 /100 | #189 | Fair 13.7% |
| Dutch | 29.7 /100 | #190 | Fair 13.8% |
| Immigrants | St. Vincent and the Grenadines | 29.3 /100 | #191 | Fair 13.8% |
Demographics Similar to Immigrants from Greece by Female Poverty Among 25-34 Year Olds
In terms of female poverty among 25-34 year olds, the demographic groups most similar to Immigrants from Greece are Immigrants from Pakistan (11.5%, a difference of 0.24%), Bulgarian (11.5%, a difference of 0.24%), Cypriot (11.5%, a difference of 0.26%), Tongan (11.5%, a difference of 0.30%), and Bhutanese (11.4%, a difference of 0.45%).
| Demographics | Rating | Rank | Female Poverty Among 25-34 Year Olds |
| Okinawans | 100.0 /100 | #20 | Exceptional 11.3% |
| Turks | 100.0 /100 | #21 | Exceptional 11.4% |
| Asians | 99.9 /100 | #22 | Exceptional 11.4% |
| Bolivians | 99.9 /100 | #23 | Exceptional 11.4% |
| Maltese | 99.9 /100 | #24 | Exceptional 11.4% |
| Bhutanese | 99.9 /100 | #25 | Exceptional 11.4% |
| Tongans | 99.9 /100 | #26 | Exceptional 11.5% |
| Immigrants | Greece | 99.9 /100 | #27 | Exceptional 11.5% |
| Immigrants | Pakistan | 99.9 /100 | #28 | Exceptional 11.5% |
| Bulgarians | 99.9 /100 | #29 | Exceptional 11.5% |
| Cypriots | 99.9 /100 | #30 | Exceptional 11.5% |
| Immigrants | Japan | 99.9 /100 | #31 | Exceptional 11.6% |
| Immigrants | Asia | 99.9 /100 | #32 | Exceptional 11.6% |
| Immigrants | Poland | 99.9 /100 | #33 | Exceptional 11.6% |
| Zimbabweans | 99.9 /100 | #34 | Exceptional 11.7% |