Menominee vs Potawatomi Female Poverty Among 25-34 Year Olds
COMPARE
Menominee
Potawatomi
Female Poverty Among 25-34 Year Olds
Female Poverty Among 25-34 Year Olds Comparison
Menominee
Potawatomi
18.0%
FEMALE POVERTY AMONG 25-34 YEAR OLDS
0.0/ 100
METRIC RATING
319th/ 347
METRIC RANK
16.5%
FEMALE POVERTY AMONG 25-34 YEAR OLDS
0.0/ 100
METRIC RATING
293rd/ 347
METRIC RANK
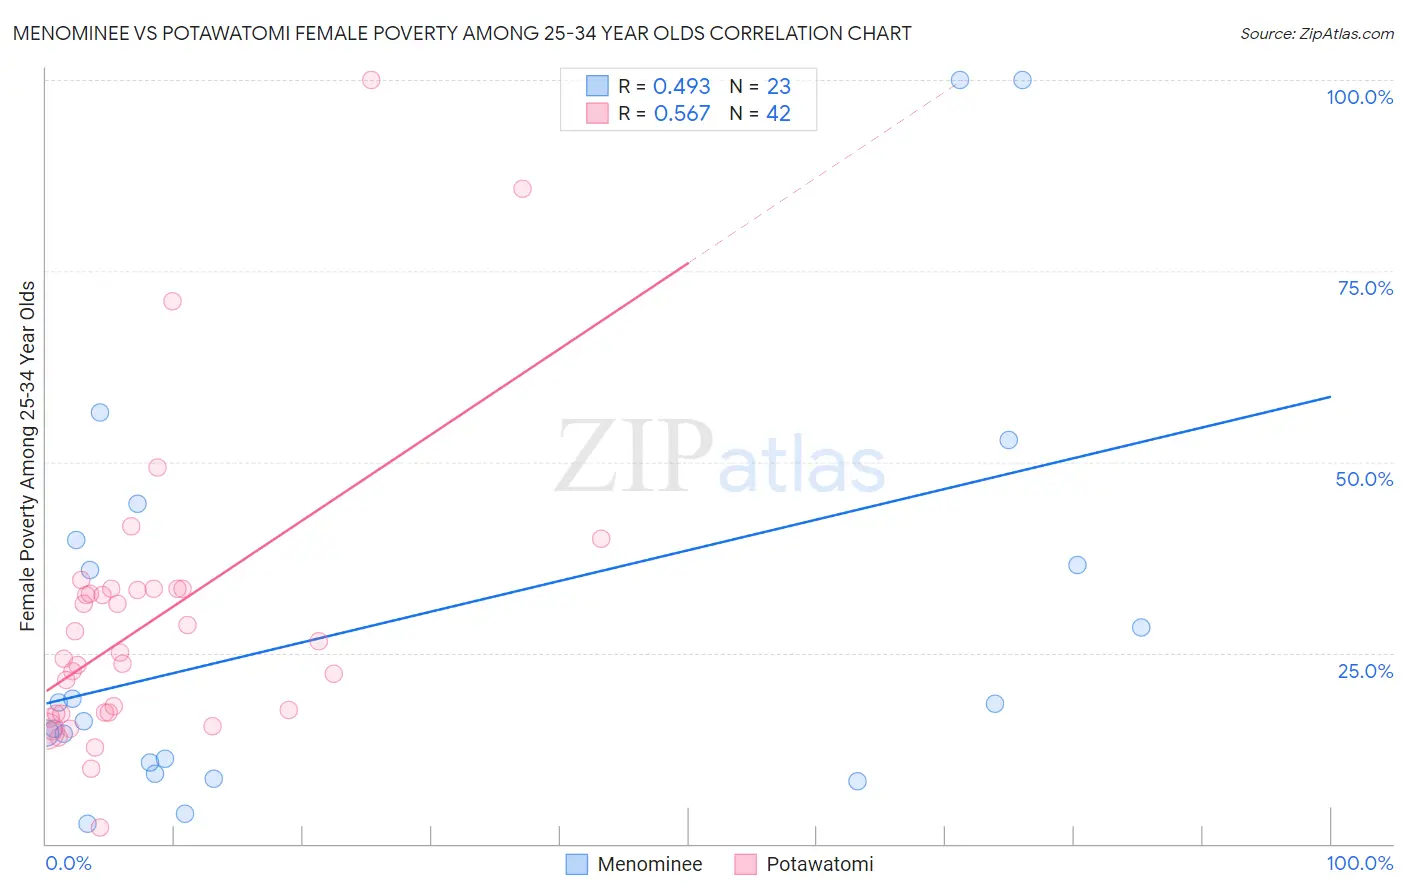
Menominee vs Potawatomi Female Poverty Among 25-34 Year Olds Correlation Chart
The statistical analysis conducted on geographies consisting of 45,599,400 people shows a moderate positive correlation between the proportion of Menominee and poverty level among females between the ages 25 and 34 in the United States with a correlation coefficient (R) of 0.493 and weighted average of 18.0%. Similarly, the statistical analysis conducted on geographies consisting of 117,213,572 people shows a substantial positive correlation between the proportion of Potawatomi and poverty level among females between the ages 25 and 34 in the United States with a correlation coefficient (R) of 0.567 and weighted average of 16.5%, a difference of 8.8%.
Female Poverty Among 25-34 Year Olds Correlation Summary
| Measurement | Menominee | Potawatomi |
| Minimum | 2.7% | 2.2% |
| Maximum | 100.0% | 100.0% |
| Range | 97.3% | 97.8% |
| Mean | 28.9% | 28.9% |
| Median | 18.4% | 24.6% |
| Interquartile 25% (IQ1) | 10.6% | 17.0% |
| Interquartile 75% (IQ3) | 39.8% | 33.3% |
| Interquartile Range (IQR) | 29.2% | 16.3% |
| Standard Deviation (Sample) | 27.1% | 18.8% |
| Standard Deviation (Population) | 26.5% | 18.6% |
Similar Demographics by Female Poverty Among 25-34 Year Olds
Demographics Similar to Menominee by Female Poverty Among 25-34 Year Olds
In terms of female poverty among 25-34 year olds, the demographic groups most similar to Menominee are Chippewa (18.0%, a difference of 0.26%), Choctaw (18.1%, a difference of 0.47%), Ute (17.9%, a difference of 0.55%), Arapaho (17.8%, a difference of 1.1%), and Central American Indian (18.2%, a difference of 1.3%).
| Demographics | Rating | Rank | Female Poverty Among 25-34 Year Olds |
| Iroquois | 0.0 /100 | #312 | Tragic 17.5% |
| Colville | 0.0 /100 | #313 | Tragic 17.5% |
| Immigrants | Dominican Republic | 0.0 /100 | #314 | Tragic 17.6% |
| Yakama | 0.0 /100 | #315 | Tragic 17.6% |
| Dominicans | 0.0 /100 | #316 | Tragic 17.6% |
| Arapaho | 0.0 /100 | #317 | Tragic 17.8% |
| Ute | 0.0 /100 | #318 | Tragic 17.9% |
| Menominee | 0.0 /100 | #319 | Tragic 18.0% |
| Chippewa | 0.0 /100 | #320 | Tragic 18.0% |
| Choctaw | 0.0 /100 | #321 | Tragic 18.1% |
| Central American Indians | 0.0 /100 | #322 | Tragic 18.2% |
| Seminole | 0.0 /100 | #323 | Tragic 18.3% |
| Dutch West Indians | 0.0 /100 | #324 | Tragic 18.4% |
| Inupiat | 0.0 /100 | #325 | Tragic 18.5% |
| Blacks/African Americans | 0.0 /100 | #326 | Tragic 18.9% |
Demographics Similar to Potawatomi by Female Poverty Among 25-34 Year Olds
In terms of female poverty among 25-34 year olds, the demographic groups most similar to Potawatomi are Immigrants from Dominica (16.5%, a difference of 0.27%), Comanche (16.5%, a difference of 0.28%), Immigrants from Central America (16.6%, a difference of 0.36%), Mexican (16.6%, a difference of 0.44%), and Indonesian (16.4%, a difference of 0.57%).
| Demographics | Rating | Rank | Female Poverty Among 25-34 Year Olds |
| Cape Verdeans | 0.0 /100 | #286 | Tragic 16.3% |
| Americans | 0.0 /100 | #287 | Tragic 16.4% |
| Guatemalans | 0.0 /100 | #288 | Tragic 16.4% |
| Osage | 0.0 /100 | #289 | Tragic 16.4% |
| Indonesians | 0.0 /100 | #290 | Tragic 16.4% |
| Comanche | 0.0 /100 | #291 | Tragic 16.5% |
| Immigrants | Dominica | 0.0 /100 | #292 | Tragic 16.5% |
| Potawatomi | 0.0 /100 | #293 | Tragic 16.5% |
| Immigrants | Central America | 0.0 /100 | #294 | Tragic 16.6% |
| Mexicans | 0.0 /100 | #295 | Tragic 16.6% |
| Hispanics or Latinos | 0.0 /100 | #296 | Tragic 16.6% |
| Immigrants | Guatemala | 0.0 /100 | #297 | Tragic 16.6% |
| Blackfeet | 0.0 /100 | #298 | Tragic 16.7% |
| Spanish Americans | 0.0 /100 | #299 | Tragic 16.7% |
| U.S. Virgin Islanders | 0.0 /100 | #300 | Tragic 16.7% |