Kenyan vs Immigrants from Greece Female Poverty Among 25-34 Year Olds
COMPARE
Kenyan
Immigrants from Greece
Female Poverty Among 25-34 Year Olds
Female Poverty Among 25-34 Year Olds Comparison
Kenyans
Immigrants from Greece
13.5%
FEMALE POVERTY AMONG 25-34 YEAR OLDS
51.8/ 100
METRIC RATING
173rd/ 347
METRIC RANK
11.5%
FEMALE POVERTY AMONG 25-34 YEAR OLDS
99.9/ 100
METRIC RATING
27th/ 347
METRIC RANK
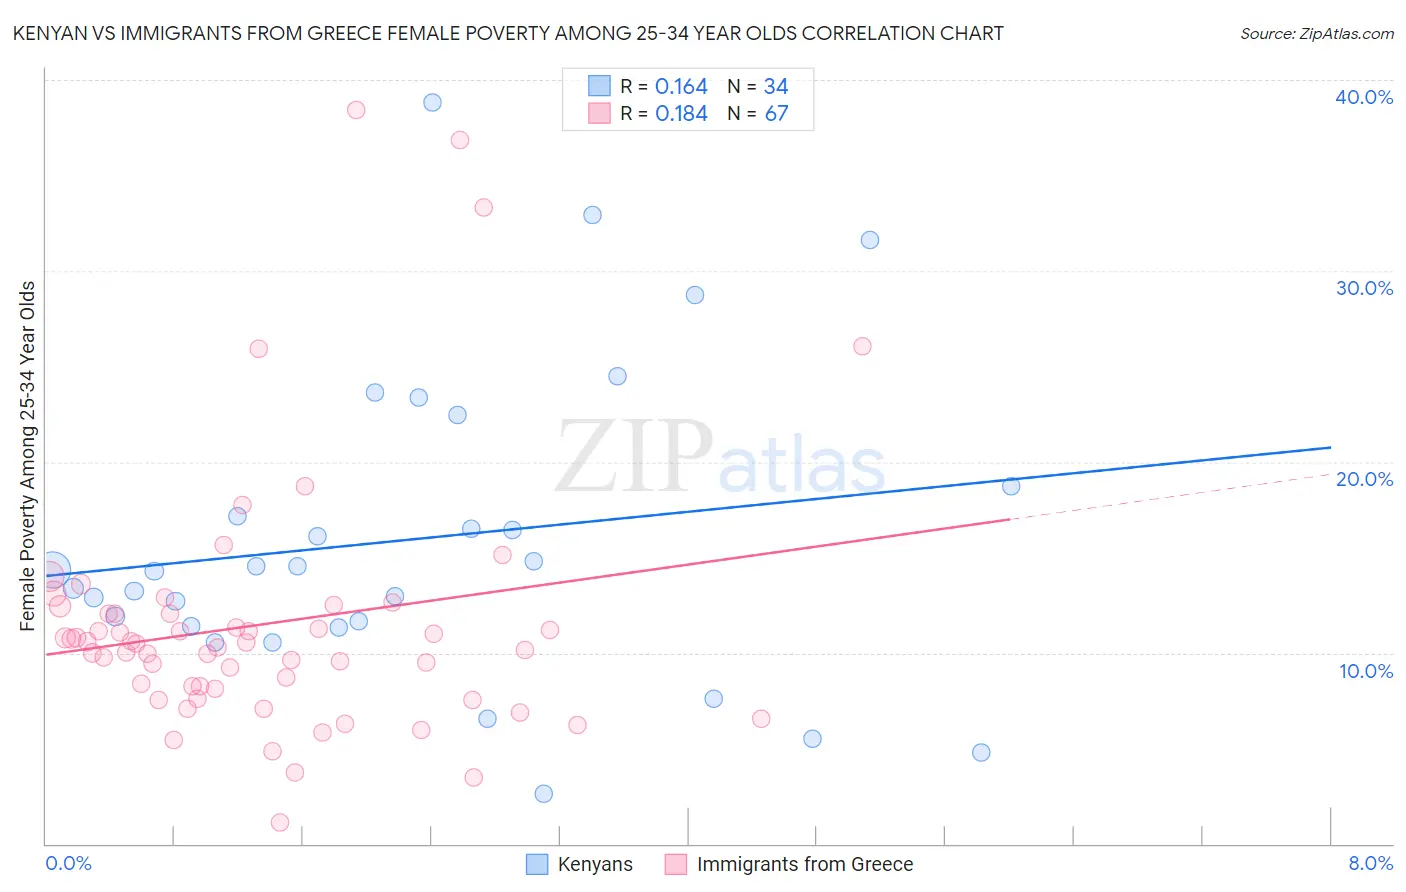
Kenyan vs Immigrants from Greece Female Poverty Among 25-34 Year Olds Correlation Chart
The statistical analysis conducted on geographies consisting of 167,556,876 people shows a poor positive correlation between the proportion of Kenyans and poverty level among females between the ages 25 and 34 in the United States with a correlation coefficient (R) of 0.164 and weighted average of 13.5%. Similarly, the statistical analysis conducted on geographies consisting of 213,891,857 people shows a poor positive correlation between the proportion of Immigrants from Greece and poverty level among females between the ages 25 and 34 in the United States with a correlation coefficient (R) of 0.184 and weighted average of 11.5%, a difference of 17.5%.
Female Poverty Among 25-34 Year Olds Correlation Summary
| Measurement | Kenyan | Immigrants from Greece |
| Minimum | 2.6% | 1.1% |
| Maximum | 38.8% | 38.5% |
| Range | 36.2% | 37.4% |
| Mean | 16.0% | 11.5% |
| Median | 14.3% | 10.5% |
| Interquartile 25% (IQ1) | 11.4% | 8.1% |
| Interquartile 75% (IQ3) | 18.8% | 12.1% |
| Interquartile Range (IQR) | 7.3% | 4.0% |
| Standard Deviation (Sample) | 8.2% | 6.8% |
| Standard Deviation (Population) | 8.1% | 6.8% |
Similar Demographics by Female Poverty Among 25-34 Year Olds
Demographics Similar to Kenyans by Female Poverty Among 25-34 Year Olds
In terms of female poverty among 25-34 year olds, the demographic groups most similar to Kenyans are South American Indian (13.5%, a difference of 0.010%), Immigrants from Costa Rica (13.5%, a difference of 0.010%), Immigrants from Uganda (13.5%, a difference of 0.10%), Immigrants from Oceania (13.5%, a difference of 0.15%), and Bermudan (13.6%, a difference of 0.41%).
| Demographics | Rating | Rank | Female Poverty Among 25-34 Year Olds |
| Belgians | 58.9 /100 | #166 | Average 13.4% |
| Immigrants | Bosnia and Herzegovina | 58.6 /100 | #167 | Average 13.4% |
| Immigrants | Afghanistan | 57.7 /100 | #168 | Average 13.4% |
| Samoans | 56.8 /100 | #169 | Average 13.5% |
| Immigrants | Uganda | 53.0 /100 | #170 | Average 13.5% |
| South American Indians | 51.9 /100 | #171 | Average 13.5% |
| Immigrants | Costa Rica | 51.9 /100 | #172 | Average 13.5% |
| Kenyans | 51.8 /100 | #173 | Average 13.5% |
| Immigrants | Oceania | 50.0 /100 | #174 | Average 13.5% |
| Bermudans | 46.8 /100 | #175 | Average 13.6% |
| Yugoslavians | 45.0 /100 | #176 | Average 13.6% |
| Venezuelans | 44.6 /100 | #177 | Average 13.6% |
| Canadians | 44.3 /100 | #178 | Average 13.6% |
| Immigrants | Eastern Africa | 43.6 /100 | #179 | Average 13.6% |
| Germans | 41.6 /100 | #180 | Average 13.6% |
Demographics Similar to Immigrants from Greece by Female Poverty Among 25-34 Year Olds
In terms of female poverty among 25-34 year olds, the demographic groups most similar to Immigrants from Greece are Immigrants from Pakistan (11.5%, a difference of 0.24%), Bulgarian (11.5%, a difference of 0.24%), Cypriot (11.5%, a difference of 0.26%), Tongan (11.5%, a difference of 0.30%), and Bhutanese (11.4%, a difference of 0.45%).
| Demographics | Rating | Rank | Female Poverty Among 25-34 Year Olds |
| Okinawans | 100.0 /100 | #20 | Exceptional 11.3% |
| Turks | 100.0 /100 | #21 | Exceptional 11.4% |
| Asians | 99.9 /100 | #22 | Exceptional 11.4% |
| Bolivians | 99.9 /100 | #23 | Exceptional 11.4% |
| Maltese | 99.9 /100 | #24 | Exceptional 11.4% |
| Bhutanese | 99.9 /100 | #25 | Exceptional 11.4% |
| Tongans | 99.9 /100 | #26 | Exceptional 11.5% |
| Immigrants | Greece | 99.9 /100 | #27 | Exceptional 11.5% |
| Immigrants | Pakistan | 99.9 /100 | #28 | Exceptional 11.5% |
| Bulgarians | 99.9 /100 | #29 | Exceptional 11.5% |
| Cypriots | 99.9 /100 | #30 | Exceptional 11.5% |
| Immigrants | Japan | 99.9 /100 | #31 | Exceptional 11.6% |
| Immigrants | Asia | 99.9 /100 | #32 | Exceptional 11.6% |
| Immigrants | Poland | 99.9 /100 | #33 | Exceptional 11.6% |
| Zimbabweans | 99.9 /100 | #34 | Exceptional 11.7% |