Menominee vs Immigrants from Nepal Female Poverty Among 25-34 Year Olds
COMPARE
Menominee
Immigrants from Nepal
Female Poverty Among 25-34 Year Olds
Female Poverty Among 25-34 Year Olds Comparison
Menominee
Immigrants from Nepal
18.0%
FEMALE POVERTY AMONG 25-34 YEAR OLDS
0.0/ 100
METRIC RATING
319th/ 347
METRIC RANK
12.8%
FEMALE POVERTY AMONG 25-34 YEAR OLDS
93.0/ 100
METRIC RATING
119th/ 347
METRIC RANK
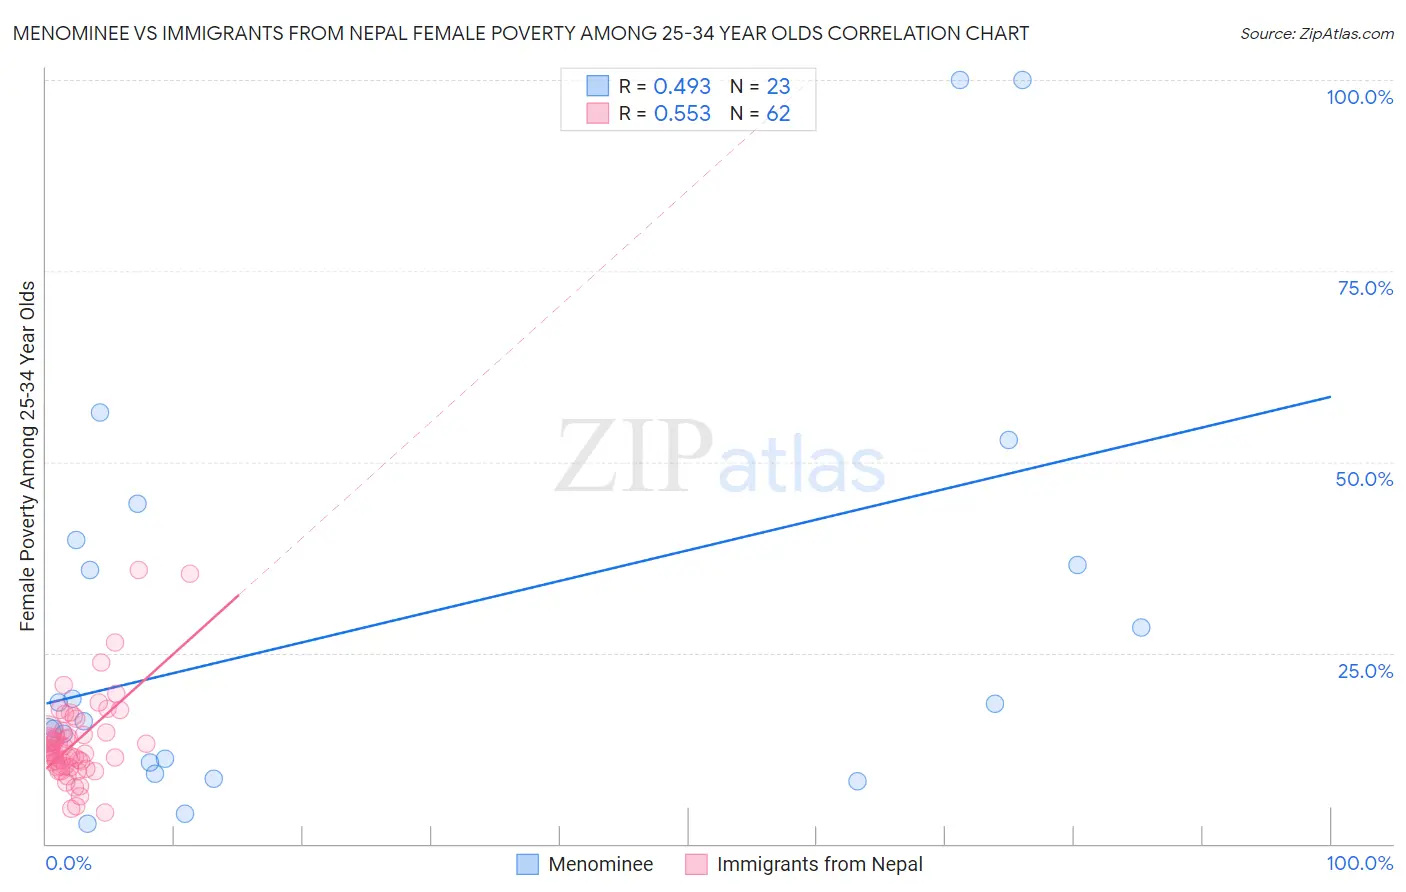
Menominee vs Immigrants from Nepal Female Poverty Among 25-34 Year Olds Correlation Chart
The statistical analysis conducted on geographies consisting of 45,599,400 people shows a moderate positive correlation between the proportion of Menominee and poverty level among females between the ages 25 and 34 in the United States with a correlation coefficient (R) of 0.493 and weighted average of 18.0%. Similarly, the statistical analysis conducted on geographies consisting of 185,514,428 people shows a substantial positive correlation between the proportion of Immigrants from Nepal and poverty level among females between the ages 25 and 34 in the United States with a correlation coefficient (R) of 0.553 and weighted average of 12.8%, a difference of 40.4%.
Female Poverty Among 25-34 Year Olds Correlation Summary
| Measurement | Menominee | Immigrants from Nepal |
| Minimum | 2.7% | 4.2% |
| Maximum | 100.0% | 35.9% |
| Range | 97.3% | 31.7% |
| Mean | 28.9% | 13.4% |
| Median | 18.4% | 12.1% |
| Interquartile 25% (IQ1) | 10.6% | 10.1% |
| Interquartile 75% (IQ3) | 39.8% | 14.5% |
| Interquartile Range (IQR) | 29.2% | 4.4% |
| Standard Deviation (Sample) | 27.1% | 5.8% |
| Standard Deviation (Population) | 26.5% | 5.8% |
Similar Demographics by Female Poverty Among 25-34 Year Olds
Demographics Similar to Menominee by Female Poverty Among 25-34 Year Olds
In terms of female poverty among 25-34 year olds, the demographic groups most similar to Menominee are Chippewa (18.0%, a difference of 0.26%), Choctaw (18.1%, a difference of 0.47%), Ute (17.9%, a difference of 0.55%), Arapaho (17.8%, a difference of 1.1%), and Central American Indian (18.2%, a difference of 1.3%).
| Demographics | Rating | Rank | Female Poverty Among 25-34 Year Olds |
| Iroquois | 0.0 /100 | #312 | Tragic 17.5% |
| Colville | 0.0 /100 | #313 | Tragic 17.5% |
| Immigrants | Dominican Republic | 0.0 /100 | #314 | Tragic 17.6% |
| Yakama | 0.0 /100 | #315 | Tragic 17.6% |
| Dominicans | 0.0 /100 | #316 | Tragic 17.6% |
| Arapaho | 0.0 /100 | #317 | Tragic 17.8% |
| Ute | 0.0 /100 | #318 | Tragic 17.9% |
| Menominee | 0.0 /100 | #319 | Tragic 18.0% |
| Chippewa | 0.0 /100 | #320 | Tragic 18.0% |
| Choctaw | 0.0 /100 | #321 | Tragic 18.1% |
| Central American Indians | 0.0 /100 | #322 | Tragic 18.2% |
| Seminole | 0.0 /100 | #323 | Tragic 18.3% |
| Dutch West Indians | 0.0 /100 | #324 | Tragic 18.4% |
| Inupiat | 0.0 /100 | #325 | Tragic 18.5% |
| Blacks/African Americans | 0.0 /100 | #326 | Tragic 18.9% |
Demographics Similar to Immigrants from Nepal by Female Poverty Among 25-34 Year Olds
In terms of female poverty among 25-34 year olds, the demographic groups most similar to Immigrants from Nepal are Carpatho Rusyn (12.8%, a difference of 0.0%), Mongolian (12.8%, a difference of 0.010%), Immigrants from Kuwait (12.8%, a difference of 0.020%), Romanian (12.8%, a difference of 0.070%), and Chilean (12.8%, a difference of 0.080%).
| Demographics | Rating | Rank | Female Poverty Among 25-34 Year Olds |
| Immigrants | Morocco | 93.9 /100 | #112 | Exceptional 12.8% |
| Immigrants | Syria | 93.8 /100 | #113 | Exceptional 12.8% |
| Immigrants | Southern Europe | 93.6 /100 | #114 | Exceptional 12.8% |
| Immigrants | Brazil | 93.3 /100 | #115 | Exceptional 12.8% |
| Chileans | 93.2 /100 | #116 | Exceptional 12.8% |
| Immigrants | Kuwait | 93.1 /100 | #117 | Exceptional 12.8% |
| Mongolians | 93.0 /100 | #118 | Exceptional 12.8% |
| Immigrants | Nepal | 93.0 /100 | #119 | Exceptional 12.8% |
| Carpatho Rusyns | 93.0 /100 | #120 | Exceptional 12.8% |
| Romanians | 92.8 /100 | #121 | Exceptional 12.8% |
| Immigrants | Western Asia | 92.7 /100 | #122 | Exceptional 12.8% |
| Slovenes | 92.7 /100 | #123 | Exceptional 12.8% |
| Immigrants | Netherlands | 92.0 /100 | #124 | Exceptional 12.8% |
| Immigrants | Canada | 91.5 /100 | #125 | Exceptional 12.9% |
| Immigrants | Fiji | 91.2 /100 | #126 | Exceptional 12.9% |