Menominee vs Immigrants from Greece Male Unemployment
COMPARE
Menominee
Immigrants from Greece
Male Unemployment
Male Unemployment Comparison
Menominee
Immigrants from Greece
6.0%
MALE UNEMPLOYMENT
0.0/ 100
METRIC RATING
275th/ 347
METRIC RANK
5.4%
MALE UNEMPLOYMENT
14.5/ 100
METRIC RATING
199th/ 347
METRIC RANK
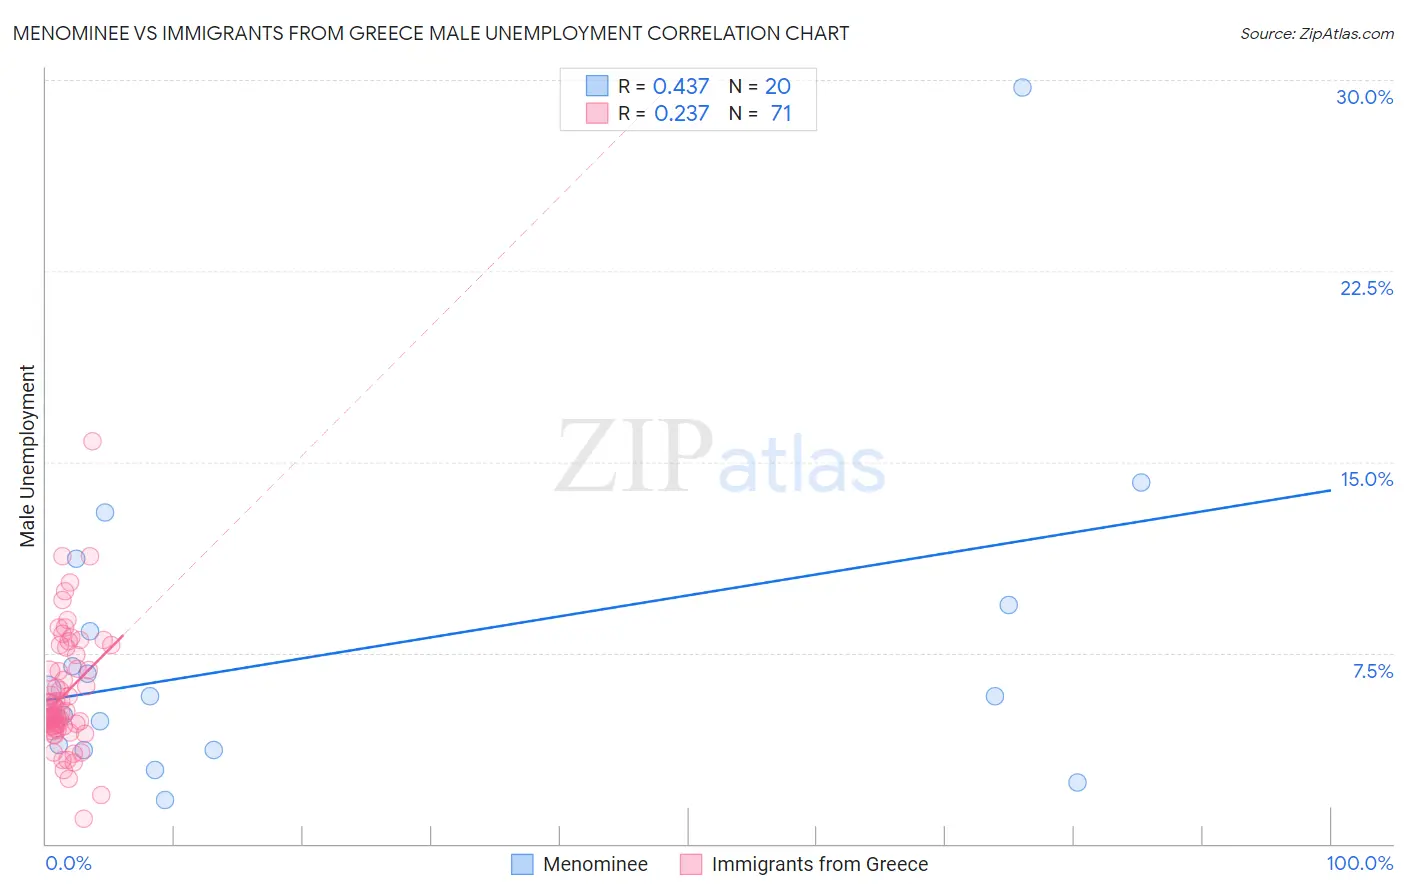
Menominee vs Immigrants from Greece Male Unemployment Correlation Chart
The statistical analysis conducted on geographies consisting of 45,696,214 people shows a moderate positive correlation between the proportion of Menominee and unemployment rate among males in the United States with a correlation coefficient (R) of 0.437 and weighted average of 6.0%. Similarly, the statistical analysis conducted on geographies consisting of 216,564,695 people shows a weak positive correlation between the proportion of Immigrants from Greece and unemployment rate among males in the United States with a correlation coefficient (R) of 0.237 and weighted average of 5.4%, a difference of 10.9%.
Male Unemployment Correlation Summary
| Measurement | Menominee | Immigrants from Greece |
| Minimum | 1.7% | 1.0% |
| Maximum | 29.7% | 15.8% |
| Range | 28.0% | 14.8% |
| Mean | 7.5% | 5.9% |
| Median | 5.8% | 5.2% |
| Interquartile 25% (IQ1) | 3.8% | 4.6% |
| Interquartile 75% (IQ3) | 8.9% | 7.4% |
| Interquartile Range (IQR) | 5.1% | 2.8% |
| Standard Deviation (Sample) | 6.2% | 2.4% |
| Standard Deviation (Population) | 6.1% | 2.4% |
Similar Demographics by Male Unemployment
Demographics Similar to Menominee by Male Unemployment
In terms of male unemployment, the demographic groups most similar to Menominee are Tlingit-Haida (6.0%, a difference of 0.10%), Immigrants from Sierra Leone (6.0%, a difference of 0.15%), Armenian (6.0%, a difference of 0.33%), Immigrants from Uzbekistan (6.0%, a difference of 0.34%), and Immigrants from Liberia (6.1%, a difference of 0.52%).
| Demographics | Rating | Rank | Male Unemployment |
| Bermudans | 0.0 /100 | #268 | Tragic 5.9% |
| Immigrants | Nigeria | 0.0 /100 | #269 | Tragic 6.0% |
| Sub-Saharan Africans | 0.0 /100 | #270 | Tragic 6.0% |
| Blackfeet | 0.0 /100 | #271 | Tragic 6.0% |
| Immigrants | Uzbekistan | 0.0 /100 | #272 | Tragic 6.0% |
| Armenians | 0.0 /100 | #273 | Tragic 6.0% |
| Immigrants | Sierra Leone | 0.0 /100 | #274 | Tragic 6.0% |
| Menominee | 0.0 /100 | #275 | Tragic 6.0% |
| Tlingit-Haida | 0.0 /100 | #276 | Tragic 6.0% |
| Immigrants | Liberia | 0.0 /100 | #277 | Tragic 6.1% |
| Immigrants | Fiji | 0.0 /100 | #278 | Tragic 6.1% |
| Ghanaians | 0.0 /100 | #279 | Tragic 6.1% |
| Immigrants | Ghana | 0.0 /100 | #280 | Tragic 6.2% |
| Sierra Leoneans | 0.0 /100 | #281 | Tragic 6.2% |
| Ecuadorians | 0.0 /100 | #282 | Tragic 6.2% |
Demographics Similar to Immigrants from Greece by Male Unemployment
In terms of male unemployment, the demographic groups most similar to Immigrants from Greece are Immigrants from Thailand (5.4%, a difference of 0.020%), Immigrants from Zaire (5.4%, a difference of 0.10%), Immigrants from Philippines (5.4%, a difference of 0.12%), Nonimmigrants (5.4%, a difference of 0.16%), and Immigrants from Laos (5.4%, a difference of 0.18%).
| Demographics | Rating | Rank | Male Unemployment |
| Immigrants | Belarus | 26.0 /100 | #192 | Fair 5.4% |
| Immigrants | Israel | 25.2 /100 | #193 | Fair 5.4% |
| Spanish | 19.7 /100 | #194 | Poor 5.4% |
| Immigrants | Southern Europe | 17.7 /100 | #195 | Poor 5.4% |
| Albanians | 17.3 /100 | #196 | Poor 5.4% |
| Alsatians | 16.7 /100 | #197 | Poor 5.4% |
| Immigrants | Thailand | 14.7 /100 | #198 | Poor 5.4% |
| Immigrants | Greece | 14.5 /100 | #199 | Poor 5.4% |
| Immigrants | Zaire | 13.7 /100 | #200 | Poor 5.4% |
| Immigrants | Philippines | 13.5 /100 | #201 | Poor 5.4% |
| Immigrants | Nonimmigrants | 13.1 /100 | #202 | Poor 5.4% |
| Immigrants | Laos | 13.0 /100 | #203 | Poor 5.4% |
| Guamanians/Chamorros | 12.3 /100 | #204 | Poor 5.4% |
| Immigrants | Costa Rica | 11.4 /100 | #205 | Poor 5.5% |
| Immigrants | Ukraine | 9.9 /100 | #206 | Tragic 5.5% |