Menominee vs Lithuanian Female Poverty Among 25-34 Year Olds
COMPARE
Menominee
Lithuanian
Female Poverty Among 25-34 Year Olds
Female Poverty Among 25-34 Year Olds Comparison
Menominee
Lithuanians
18.0%
FEMALE POVERTY AMONG 25-34 YEAR OLDS
0.0/ 100
METRIC RATING
319th/ 347
METRIC RANK
12.2%
FEMALE POVERTY AMONG 25-34 YEAR OLDS
99.1/ 100
METRIC RATING
72nd/ 347
METRIC RANK
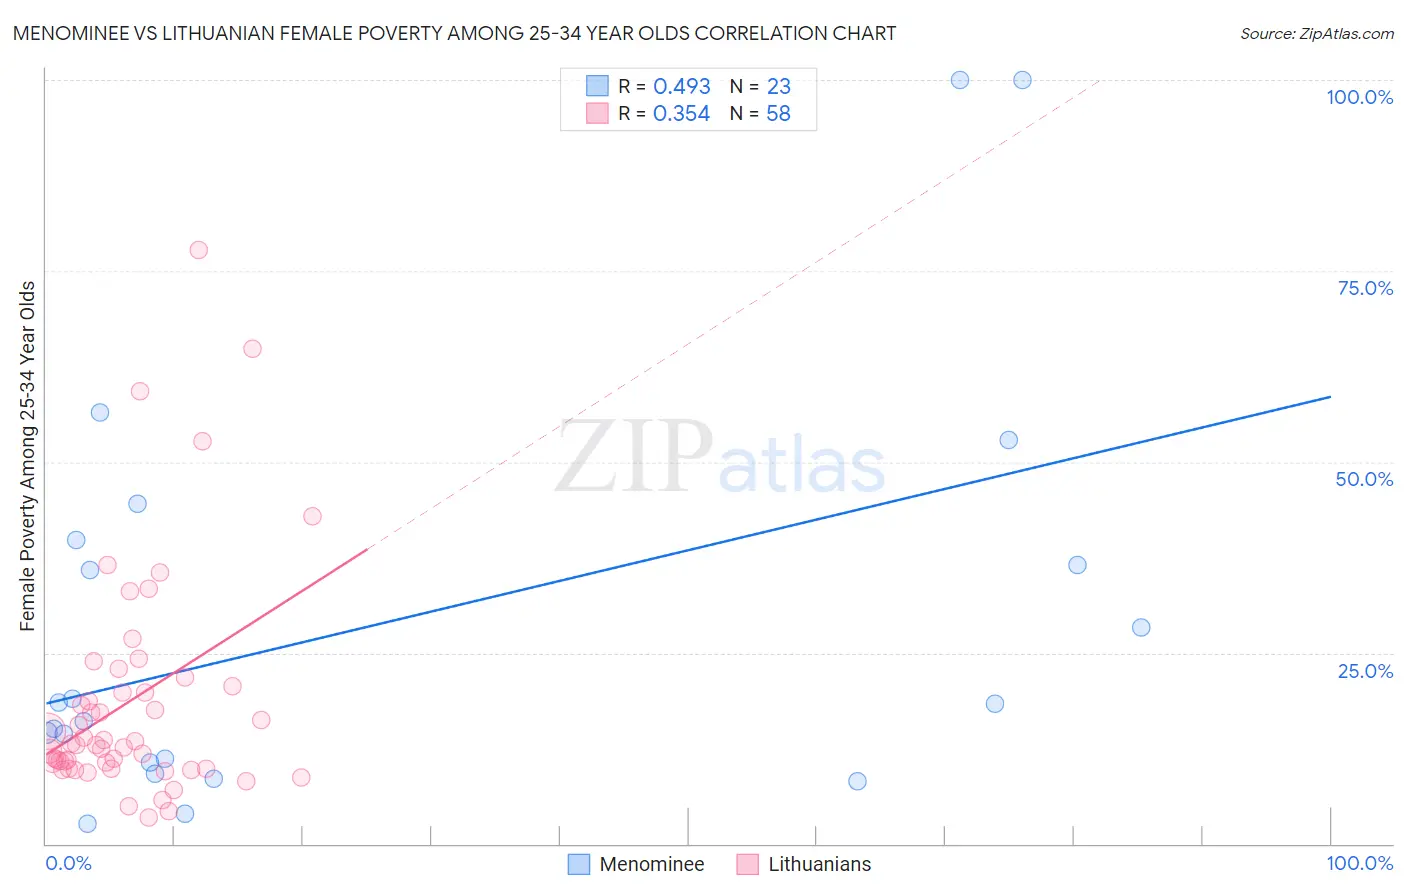
Menominee vs Lithuanian Female Poverty Among 25-34 Year Olds Correlation Chart
The statistical analysis conducted on geographies consisting of 45,599,400 people shows a moderate positive correlation between the proportion of Menominee and poverty level among females between the ages 25 and 34 in the United States with a correlation coefficient (R) of 0.493 and weighted average of 18.0%. Similarly, the statistical analysis conducted on geographies consisting of 411,639,543 people shows a mild positive correlation between the proportion of Lithuanians and poverty level among females between the ages 25 and 34 in the United States with a correlation coefficient (R) of 0.354 and weighted average of 12.2%, a difference of 47.0%.
Female Poverty Among 25-34 Year Olds Correlation Summary
| Measurement | Menominee | Lithuanian |
| Minimum | 2.7% | 3.4% |
| Maximum | 100.0% | 77.8% |
| Range | 97.3% | 74.3% |
| Mean | 28.9% | 18.7% |
| Median | 18.4% | 13.0% |
| Interquartile 25% (IQ1) | 10.6% | 9.9% |
| Interquartile 75% (IQ3) | 39.8% | 20.6% |
| Interquartile Range (IQR) | 29.2% | 10.7% |
| Standard Deviation (Sample) | 27.1% | 15.0% |
| Standard Deviation (Population) | 26.5% | 14.9% |
Similar Demographics by Female Poverty Among 25-34 Year Olds
Demographics Similar to Menominee by Female Poverty Among 25-34 Year Olds
In terms of female poverty among 25-34 year olds, the demographic groups most similar to Menominee are Chippewa (18.0%, a difference of 0.26%), Choctaw (18.1%, a difference of 0.47%), Ute (17.9%, a difference of 0.55%), Arapaho (17.8%, a difference of 1.1%), and Central American Indian (18.2%, a difference of 1.3%).
| Demographics | Rating | Rank | Female Poverty Among 25-34 Year Olds |
| Iroquois | 0.0 /100 | #312 | Tragic 17.5% |
| Colville | 0.0 /100 | #313 | Tragic 17.5% |
| Immigrants | Dominican Republic | 0.0 /100 | #314 | Tragic 17.6% |
| Yakama | 0.0 /100 | #315 | Tragic 17.6% |
| Dominicans | 0.0 /100 | #316 | Tragic 17.6% |
| Arapaho | 0.0 /100 | #317 | Tragic 17.8% |
| Ute | 0.0 /100 | #318 | Tragic 17.9% |
| Menominee | 0.0 /100 | #319 | Tragic 18.0% |
| Chippewa | 0.0 /100 | #320 | Tragic 18.0% |
| Choctaw | 0.0 /100 | #321 | Tragic 18.1% |
| Central American Indians | 0.0 /100 | #322 | Tragic 18.2% |
| Seminole | 0.0 /100 | #323 | Tragic 18.3% |
| Dutch West Indians | 0.0 /100 | #324 | Tragic 18.4% |
| Inupiat | 0.0 /100 | #325 | Tragic 18.5% |
| Blacks/African Americans | 0.0 /100 | #326 | Tragic 18.9% |
Demographics Similar to Lithuanians by Female Poverty Among 25-34 Year Olds
In terms of female poverty among 25-34 year olds, the demographic groups most similar to Lithuanians are Immigrants from Scotland (12.2%, a difference of 0.050%), Immigrants from Belgium (12.2%, a difference of 0.060%), Immigrants from Lebanon (12.2%, a difference of 0.090%), Sri Lankan (12.2%, a difference of 0.12%), and Immigrants from Vietnam (12.3%, a difference of 0.31%).
| Demographics | Rating | Rank | Female Poverty Among 25-34 Year Olds |
| Armenians | 99.2 /100 | #65 | Exceptional 12.2% |
| Immigrants | Europe | 99.2 /100 | #66 | Exceptional 12.2% |
| Laotians | 99.2 /100 | #67 | Exceptional 12.2% |
| Sri Lankans | 99.1 /100 | #68 | Exceptional 12.2% |
| Immigrants | Lebanon | 99.1 /100 | #69 | Exceptional 12.2% |
| Immigrants | Belgium | 99.1 /100 | #70 | Exceptional 12.2% |
| Immigrants | Scotland | 99.1 /100 | #71 | Exceptional 12.2% |
| Lithuanians | 99.1 /100 | #72 | Exceptional 12.2% |
| Immigrants | Vietnam | 98.9 /100 | #73 | Exceptional 12.3% |
| Immigrants | Sweden | 98.9 /100 | #74 | Exceptional 12.3% |
| Estonians | 98.9 /100 | #75 | Exceptional 12.3% |
| Greeks | 98.9 /100 | #76 | Exceptional 12.3% |
| Immigrants | Italy | 98.8 /100 | #77 | Exceptional 12.3% |
| Immigrants | Ukraine | 98.6 /100 | #78 | Exceptional 12.3% |
| Immigrants | Jordan | 98.5 /100 | #79 | Exceptional 12.4% |