Malaysian vs Immigrants from Sudan 6th Grade
COMPARE
Malaysian
Immigrants from Sudan
6th Grade
6th Grade Comparison
Malaysians
Immigrants from Sudan
96.2%
6TH GRADE
0.0/ 100
METRIC RATING
288th/ 347
METRIC RANK
96.8%
6TH GRADE
8.7/ 100
METRIC RATING
213th/ 347
METRIC RANK
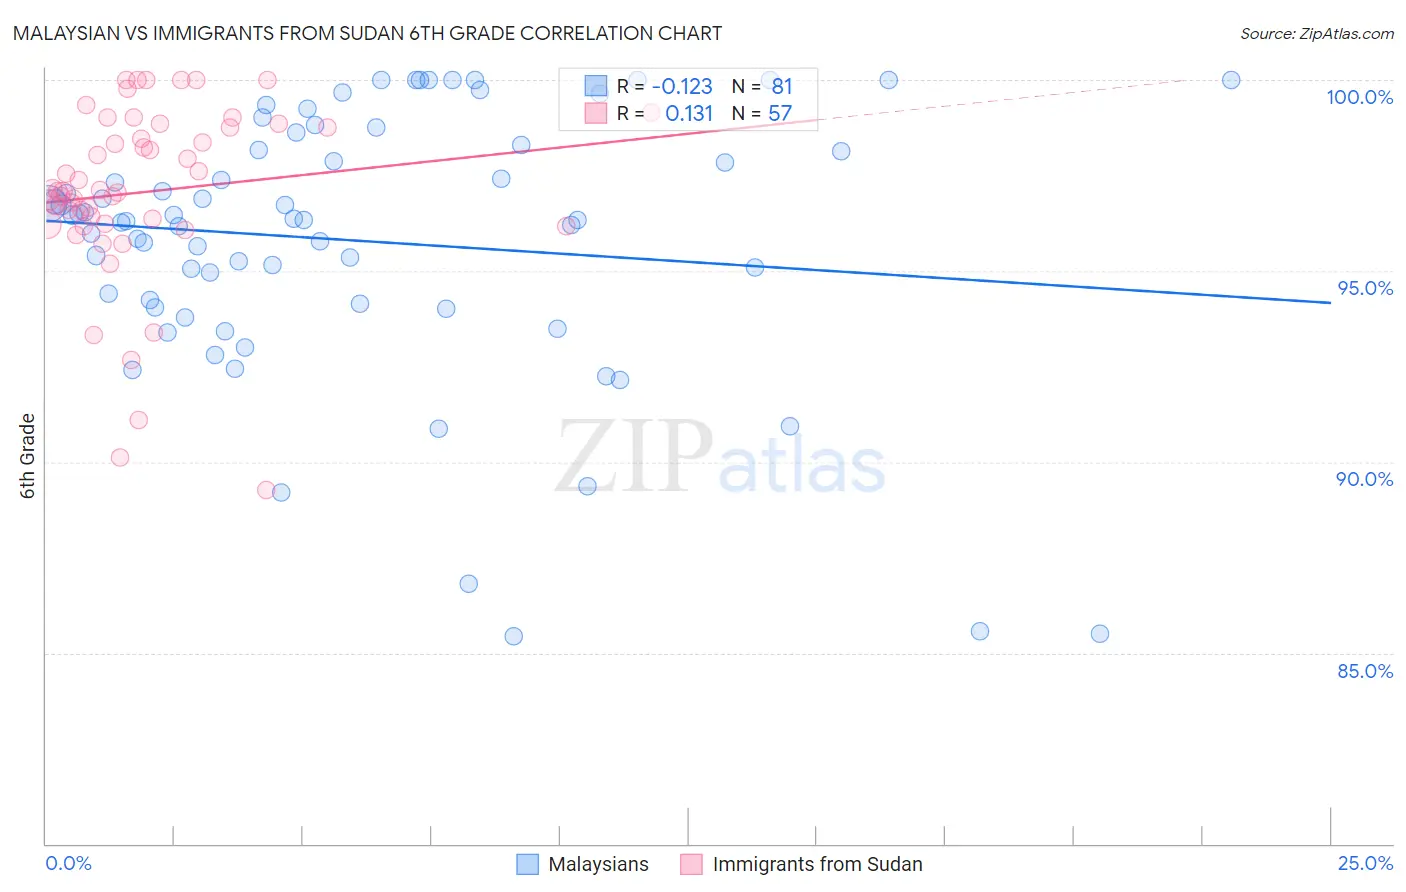
Malaysian vs Immigrants from Sudan 6th Grade Correlation Chart
The statistical analysis conducted on geographies consisting of 226,107,000 people shows a poor negative correlation between the proportion of Malaysians and percentage of population with at least 6th grade education in the United States with a correlation coefficient (R) of -0.123 and weighted average of 96.2%. Similarly, the statistical analysis conducted on geographies consisting of 118,959,807 people shows a poor positive correlation between the proportion of Immigrants from Sudan and percentage of population with at least 6th grade education in the United States with a correlation coefficient (R) of 0.131 and weighted average of 96.8%, a difference of 0.66%.
6th Grade Correlation Summary
| Measurement | Malaysian | Immigrants from Sudan |
| Minimum | 85.4% | 89.3% |
| Maximum | 100.0% | 100.0% |
| Range | 14.6% | 10.7% |
| Mean | 95.8% | 97.1% |
| Median | 96.3% | 97.1% |
| Interquartile 25% (IQ1) | 94.1% | 96.2% |
| Interquartile 75% (IQ3) | 98.2% | 98.8% |
| Interquartile Range (IQR) | 4.2% | 2.6% |
| Standard Deviation (Sample) | 3.5% | 2.3% |
| Standard Deviation (Population) | 3.4% | 2.3% |
Similar Demographics by 6th Grade
Demographics Similar to Malaysians by 6th Grade
In terms of 6th grade, the demographic groups most similar to Malaysians are Immigrants from Trinidad and Tobago (96.2%, a difference of 0.010%), Barbadian (96.2%, a difference of 0.020%), Immigrants from Eritrea (96.1%, a difference of 0.020%), Immigrants from Somalia (96.1%, a difference of 0.040%), and Immigrants from St. Vincent and the Grenadines (96.1%, a difference of 0.040%).
| Demographics | Rating | Rank | 6th Grade |
| Trinidadians and Tobagonians | 0.1 /100 | #281 | Tragic 96.2% |
| Houma | 0.1 /100 | #282 | Tragic 96.2% |
| Cubans | 0.1 /100 | #283 | Tragic 96.2% |
| Fijians | 0.1 /100 | #284 | Tragic 96.2% |
| Somalis | 0.1 /100 | #285 | Tragic 96.2% |
| Barbadians | 0.0 /100 | #286 | Tragic 96.2% |
| Immigrants | Trinidad and Tobago | 0.0 /100 | #287 | Tragic 96.2% |
| Malaysians | 0.0 /100 | #288 | Tragic 96.2% |
| Immigrants | Eritrea | 0.0 /100 | #289 | Tragic 96.1% |
| Immigrants | Somalia | 0.0 /100 | #290 | Tragic 96.1% |
| Immigrants | St. Vincent and the Grenadines | 0.0 /100 | #291 | Tragic 96.1% |
| Immigrants | Barbados | 0.0 /100 | #292 | Tragic 96.1% |
| Immigrants | West Indies | 0.0 /100 | #293 | Tragic 96.1% |
| British West Indians | 0.0 /100 | #294 | Tragic 96.0% |
| Immigrants | Grenada | 0.0 /100 | #295 | Tragic 95.9% |
Demographics Similar to Immigrants from Sudan by 6th Grade
In terms of 6th grade, the demographic groups most similar to Immigrants from Sudan are Moroccan (96.8%, a difference of 0.0%), Immigrants from Iraq (96.8%, a difference of 0.010%), Portuguese (96.8%, a difference of 0.010%), Sierra Leonean (96.8%, a difference of 0.010%), and Paiute (96.8%, a difference of 0.010%).
| Demographics | Rating | Rank | 6th Grade |
| Laotians | 11.8 /100 | #206 | Poor 96.8% |
| Iraqis | 11.7 /100 | #207 | Poor 96.8% |
| Samoans | 11.0 /100 | #208 | Poor 96.8% |
| Immigrants | Oceania | 11.0 /100 | #209 | Poor 96.8% |
| Immigrants | Nepal | 10.1 /100 | #210 | Poor 96.8% |
| Immigrants | Iraq | 9.2 /100 | #211 | Tragic 96.8% |
| Moroccans | 9.0 /100 | #212 | Tragic 96.8% |
| Immigrants | Sudan | 8.7 /100 | #213 | Tragic 96.8% |
| Portuguese | 8.2 /100 | #214 | Tragic 96.8% |
| Sierra Leoneans | 8.0 /100 | #215 | Tragic 96.8% |
| Paiute | 7.8 /100 | #216 | Tragic 96.8% |
| Liberians | 7.5 /100 | #217 | Tragic 96.8% |
| Navajo | 7.3 /100 | #218 | Tragic 96.8% |
| Costa Ricans | 6.8 /100 | #219 | Tragic 96.8% |
| Immigrants | Morocco | 6.2 /100 | #220 | Tragic 96.7% |