Malaysian vs Immigrants from Honduras Male Poverty
COMPARE
Malaysian
Immigrants from Honduras
Male Poverty
Male Poverty Comparison
Malaysians
Immigrants from Honduras
12.0%
MALE POVERTY
5.2/ 100
METRIC RATING
207th/ 347
METRIC RANK
14.6%
MALE POVERTY
0.0/ 100
METRIC RATING
314th/ 347
METRIC RANK
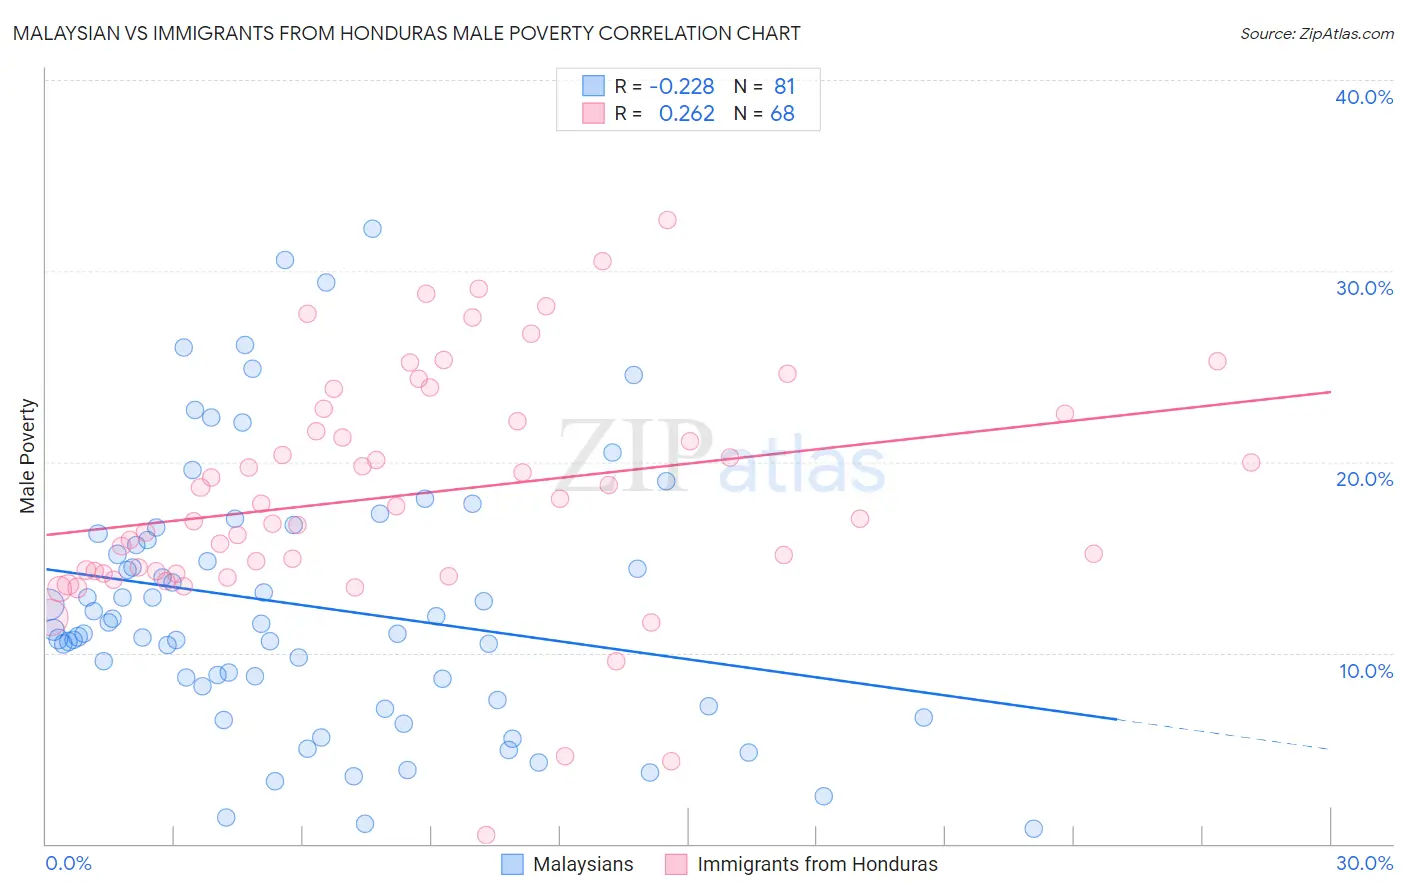
Malaysian vs Immigrants from Honduras Male Poverty Correlation Chart
The statistical analysis conducted on geographies consisting of 225,986,127 people shows a weak negative correlation between the proportion of Malaysians and poverty level among males in the United States with a correlation coefficient (R) of -0.228 and weighted average of 12.0%. Similarly, the statistical analysis conducted on geographies consisting of 322,443,990 people shows a weak positive correlation between the proportion of Immigrants from Honduras and poverty level among males in the United States with a correlation coefficient (R) of 0.262 and weighted average of 14.6%, a difference of 21.7%.
Male Poverty Correlation Summary
| Measurement | Malaysian | Immigrants from Honduras |
| Minimum | 0.78% | 0.43% |
| Maximum | 32.2% | 32.7% |
| Range | 31.4% | 32.3% |
| Mean | 12.5% | 18.3% |
| Median | 11.2% | 17.4% |
| Interquartile 25% (IQ1) | 7.9% | 14.2% |
| Interquartile 75% (IQ3) | 16.1% | 22.3% |
| Interquartile Range (IQR) | 8.2% | 8.1% |
| Standard Deviation (Sample) | 6.9% | 6.2% |
| Standard Deviation (Population) | 6.9% | 6.1% |
Similar Demographics by Male Poverty
Demographics Similar to Malaysians by Male Poverty
In terms of male poverty, the demographic groups most similar to Malaysians are Immigrants from Eastern Africa (12.0%, a difference of 0.10%), Immigrants (12.0%, a difference of 0.33%), Immigrants from the Azores (12.0%, a difference of 0.44%), Panamanian (11.9%, a difference of 0.45%), and Moroccan (12.0%, a difference of 0.50%).
| Demographics | Rating | Rank | Male Poverty |
| Immigrants | Lebanon | 13.6 /100 | #200 | Poor 11.7% |
| Spaniards | 13.5 /100 | #201 | Poor 11.7% |
| Aleuts | 10.4 /100 | #202 | Poor 11.8% |
| Immigrants | Western Asia | 9.8 /100 | #203 | Tragic 11.8% |
| Immigrants | Uganda | 8.5 /100 | #204 | Tragic 11.8% |
| Panamanians | 6.2 /100 | #205 | Tragic 11.9% |
| Immigrants | Eastern Africa | 5.4 /100 | #206 | Tragic 12.0% |
| Malaysians | 5.2 /100 | #207 | Tragic 12.0% |
| Immigrants | Immigrants | 4.5 /100 | #208 | Tragic 12.0% |
| Immigrants | Azores | 4.3 /100 | #209 | Tragic 12.0% |
| Moroccans | 4.2 /100 | #210 | Tragic 12.0% |
| Immigrants | Panama | 4.0 /100 | #211 | Tragic 12.1% |
| Americans | 3.2 /100 | #212 | Tragic 12.1% |
| Immigrants | Nonimmigrants | 3.1 /100 | #213 | Tragic 12.1% |
| Japanese | 2.7 /100 | #214 | Tragic 12.2% |
Demographics Similar to Immigrants from Honduras by Male Poverty
In terms of male poverty, the demographic groups most similar to Immigrants from Honduras are Immigrants from Somalia (14.6%, a difference of 0.040%), Chippewa (14.6%, a difference of 0.080%), British West Indian (14.6%, a difference of 0.10%), Immigrants from Dominica (14.7%, a difference of 0.78%), and Immigrants from Grenada (14.7%, a difference of 0.84%).
| Demographics | Rating | Rank | Male Poverty |
| Dutch West Indians | 0.0 /100 | #307 | Tragic 14.2% |
| Africans | 0.0 /100 | #308 | Tragic 14.2% |
| Somalis | 0.0 /100 | #309 | Tragic 14.3% |
| Seminole | 0.0 /100 | #310 | Tragic 14.3% |
| Hondurans | 0.0 /100 | #311 | Tragic 14.3% |
| Choctaw | 0.0 /100 | #312 | Tragic 14.4% |
| Immigrants | Somalia | 0.0 /100 | #313 | Tragic 14.6% |
| Immigrants | Honduras | 0.0 /100 | #314 | Tragic 14.6% |
| Chippewa | 0.0 /100 | #315 | Tragic 14.6% |
| British West Indians | 0.0 /100 | #316 | Tragic 14.6% |
| Immigrants | Dominica | 0.0 /100 | #317 | Tragic 14.7% |
| Immigrants | Grenada | 0.0 /100 | #318 | Tragic 14.7% |
| U.S. Virgin Islanders | 0.0 /100 | #319 | Tragic 14.7% |
| Immigrants | Congo | 0.0 /100 | #320 | Tragic 14.7% |
| Arapaho | 0.0 /100 | #321 | Tragic 15.1% |