Malaysian vs British West Indian Single Female Poverty
COMPARE
Malaysian
British West Indian
Single Female Poverty
Single Female Poverty Comparison
Malaysians
British West Indians
22.2%
SINGLE FEMALE POVERTY
2.8/ 100
METRIC RATING
239th/ 347
METRIC RANK
22.8%
SINGLE FEMALE POVERTY
0.4/ 100
METRIC RATING
262nd/ 347
METRIC RANK
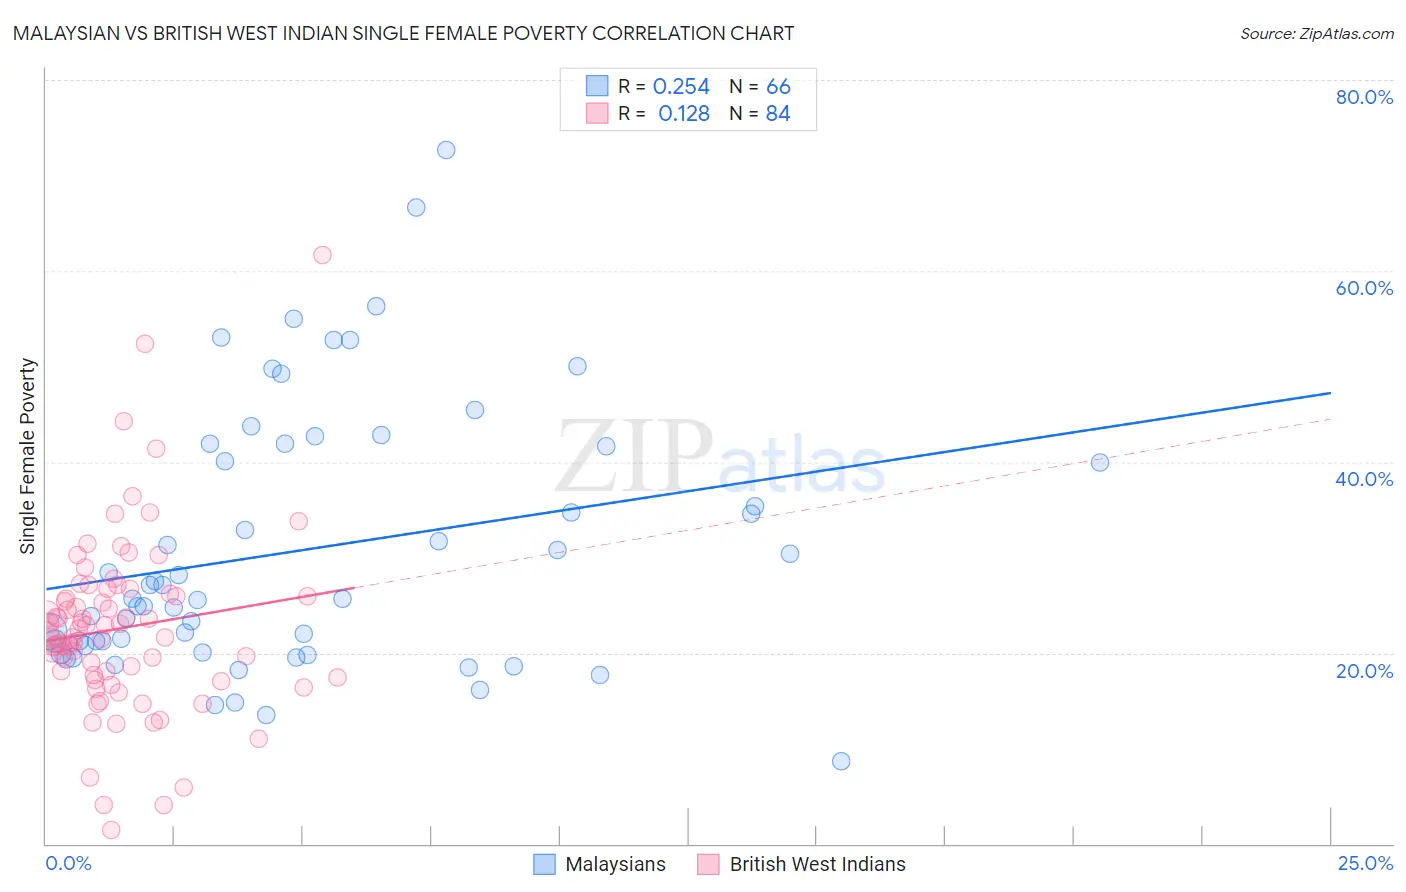
Malaysian vs British West Indian Single Female Poverty Correlation Chart
The statistical analysis conducted on geographies consisting of 224,481,570 people shows a weak positive correlation between the proportion of Malaysians and poverty level among single females in the United States with a correlation coefficient (R) of 0.254 and weighted average of 22.2%. Similarly, the statistical analysis conducted on geographies consisting of 151,955,879 people shows a poor positive correlation between the proportion of British West Indians and poverty level among single females in the United States with a correlation coefficient (R) of 0.128 and weighted average of 22.8%, a difference of 3.0%.
Single Female Poverty Correlation Summary
| Measurement | Malaysian | British West Indian |
| Minimum | 8.7% | 1.4% |
| Maximum | 72.7% | 61.7% |
| Range | 64.0% | 60.3% |
| Mean | 30.8% | 22.6% |
| Median | 25.6% | 21.9% |
| Interquartile 25% (IQ1) | 20.8% | 17.6% |
| Interquartile 75% (IQ3) | 41.7% | 26.0% |
| Interquartile Range (IQR) | 20.9% | 8.5% |
| Standard Deviation (Sample) | 13.7% | 9.4% |
| Standard Deviation (Population) | 13.6% | 9.3% |
Similar Demographics by Single Female Poverty
Demographics Similar to Malaysians by Single Female Poverty
In terms of single female poverty, the demographic groups most similar to Malaysians are French Canadian (22.2%, a difference of 0.0%), French (22.2%, a difference of 0.26%), Cape Verdean (22.3%, a difference of 0.40%), Bermudan (22.3%, a difference of 0.48%), and Vietnamese (22.0%, a difference of 0.56%).
| Demographics | Rating | Rank | Single Female Poverty |
| Immigrants | Thailand | 5.0 /100 | #232 | Tragic 22.0% |
| Spaniards | 4.7 /100 | #233 | Tragic 22.0% |
| Spanish | 4.7 /100 | #234 | Tragic 22.0% |
| Dutch | 4.6 /100 | #235 | Tragic 22.0% |
| Immigrants | Ecuador | 4.2 /100 | #236 | Tragic 22.0% |
| Vietnamese | 4.0 /100 | #237 | Tragic 22.0% |
| French Canadians | 2.8 /100 | #238 | Tragic 22.2% |
| Malaysians | 2.8 /100 | #239 | Tragic 22.2% |
| French | 2.3 /100 | #240 | Tragic 22.2% |
| Cape Verdeans | 2.1 /100 | #241 | Tragic 22.3% |
| Bermudans | 2.0 /100 | #242 | Tragic 22.3% |
| West Indians | 1.9 /100 | #243 | Tragic 22.3% |
| Immigrants | Middle Africa | 1.9 /100 | #244 | Tragic 22.3% |
| Immigrants | Bangladesh | 1.8 /100 | #245 | Tragic 22.3% |
| Liberians | 1.4 /100 | #246 | Tragic 22.4% |
Demographics Similar to British West Indians by Single Female Poverty
In terms of single female poverty, the demographic groups most similar to British West Indians are Immigrants from Cabo Verde (22.8%, a difference of 0.25%), Scotch-Irish (22.9%, a difference of 0.41%), Immigrants from Laos (22.9%, a difference of 0.48%), Celtic (22.7%, a difference of 0.52%), and White/Caucasian (22.7%, a difference of 0.59%).
| Demographics | Rating | Rank | Single Female Poverty |
| Immigrants | Sudan | 0.8 /100 | #255 | Tragic 22.6% |
| Immigrants | Belize | 0.8 /100 | #256 | Tragic 22.6% |
| Sudanese | 0.7 /100 | #257 | Tragic 22.6% |
| Bahamians | 0.6 /100 | #258 | Tragic 22.7% |
| Whites/Caucasians | 0.6 /100 | #259 | Tragic 22.7% |
| Celtics | 0.5 /100 | #260 | Tragic 22.7% |
| Immigrants | Cabo Verde | 0.4 /100 | #261 | Tragic 22.8% |
| British West Indians | 0.4 /100 | #262 | Tragic 22.8% |
| Scotch-Irish | 0.3 /100 | #263 | Tragic 22.9% |
| Immigrants | Laos | 0.3 /100 | #264 | Tragic 22.9% |
| Central Americans | 0.2 /100 | #265 | Tragic 23.0% |
| Immigrants | Micronesia | 0.2 /100 | #266 | Tragic 23.0% |
| Senegalese | 0.2 /100 | #267 | Tragic 23.0% |
| Fijians | 0.2 /100 | #268 | Tragic 23.1% |
| Hmong | 0.2 /100 | #269 | Tragic 23.1% |