Malaysian vs Immigrants from Korea Single Female Poverty
COMPARE
Malaysian
Immigrants from Korea
Single Female Poverty
Single Female Poverty Comparison
Malaysians
Immigrants from Korea
22.2%
SINGLE FEMALE POVERTY
2.8/ 100
METRIC RATING
239th/ 347
METRIC RANK
18.1%
SINGLE FEMALE POVERTY
100.0/ 100
METRIC RATING
17th/ 347
METRIC RANK
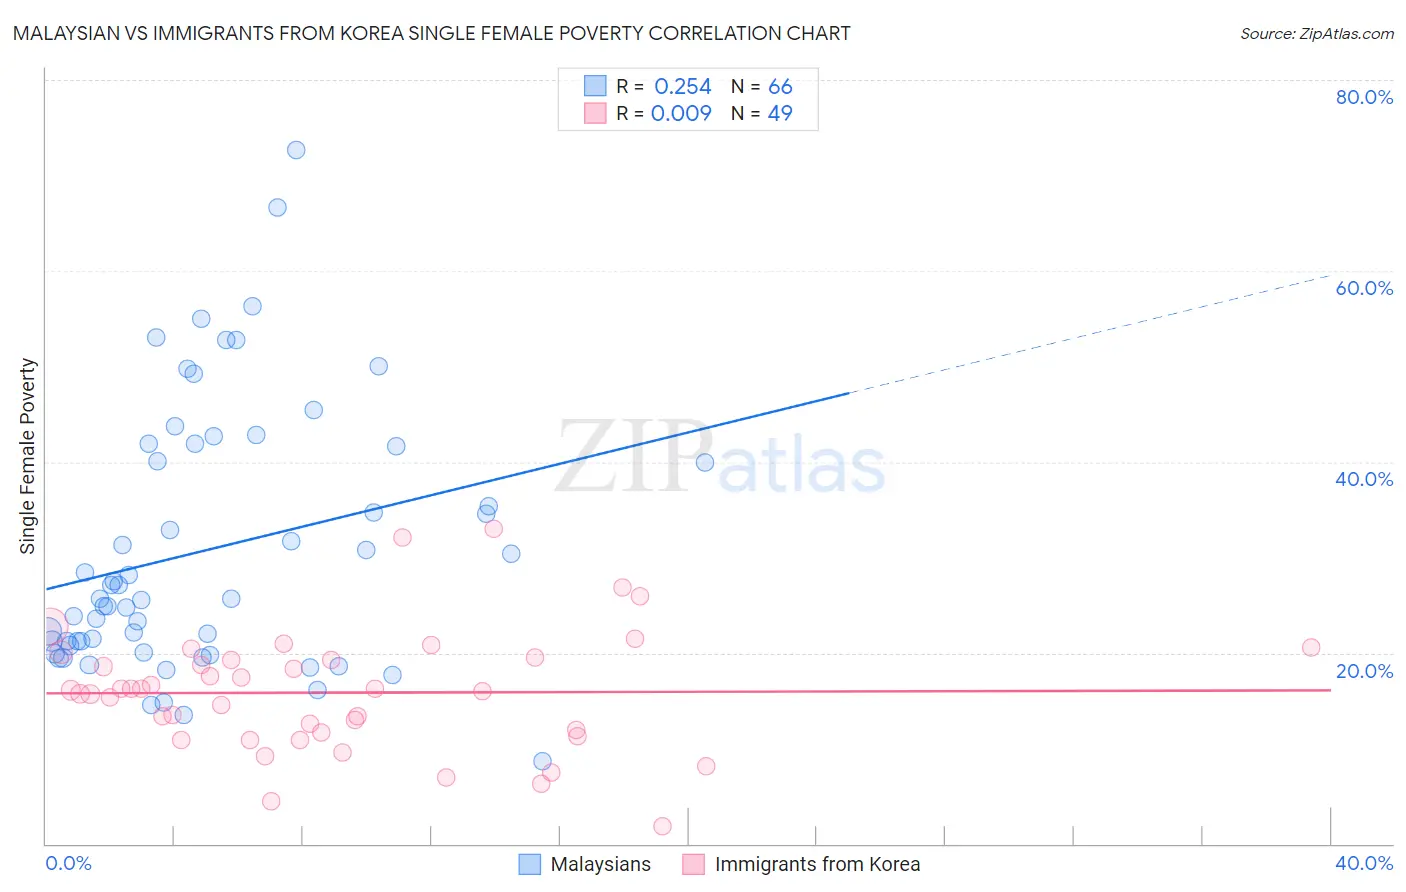
Malaysian vs Immigrants from Korea Single Female Poverty Correlation Chart
The statistical analysis conducted on geographies consisting of 224,481,570 people shows a weak positive correlation between the proportion of Malaysians and poverty level among single females in the United States with a correlation coefficient (R) of 0.254 and weighted average of 22.2%. Similarly, the statistical analysis conducted on geographies consisting of 408,307,529 people shows no correlation between the proportion of Immigrants from Korea and poverty level among single females in the United States with a correlation coefficient (R) of 0.009 and weighted average of 18.1%, a difference of 22.6%.
Single Female Poverty Correlation Summary
| Measurement | Malaysian | Immigrants from Korea |
| Minimum | 8.7% | 1.8% |
| Maximum | 72.7% | 33.0% |
| Range | 64.0% | 31.2% |
| Mean | 30.8% | 15.8% |
| Median | 25.6% | 16.1% |
| Interquartile 25% (IQ1) | 20.8% | 11.4% |
| Interquartile 75% (IQ3) | 41.7% | 19.4% |
| Interquartile Range (IQR) | 20.9% | 8.0% |
| Standard Deviation (Sample) | 13.7% | 6.3% |
| Standard Deviation (Population) | 13.6% | 6.3% |
Similar Demographics by Single Female Poverty
Demographics Similar to Malaysians by Single Female Poverty
In terms of single female poverty, the demographic groups most similar to Malaysians are French Canadian (22.2%, a difference of 0.0%), French (22.2%, a difference of 0.26%), Cape Verdean (22.3%, a difference of 0.40%), Bermudan (22.3%, a difference of 0.48%), and Vietnamese (22.0%, a difference of 0.56%).
| Demographics | Rating | Rank | Single Female Poverty |
| Immigrants | Thailand | 5.0 /100 | #232 | Tragic 22.0% |
| Spaniards | 4.7 /100 | #233 | Tragic 22.0% |
| Spanish | 4.7 /100 | #234 | Tragic 22.0% |
| Dutch | 4.6 /100 | #235 | Tragic 22.0% |
| Immigrants | Ecuador | 4.2 /100 | #236 | Tragic 22.0% |
| Vietnamese | 4.0 /100 | #237 | Tragic 22.0% |
| French Canadians | 2.8 /100 | #238 | Tragic 22.2% |
| Malaysians | 2.8 /100 | #239 | Tragic 22.2% |
| French | 2.3 /100 | #240 | Tragic 22.2% |
| Cape Verdeans | 2.1 /100 | #241 | Tragic 22.3% |
| Bermudans | 2.0 /100 | #242 | Tragic 22.3% |
| West Indians | 1.9 /100 | #243 | Tragic 22.3% |
| Immigrants | Middle Africa | 1.9 /100 | #244 | Tragic 22.3% |
| Immigrants | Bangladesh | 1.8 /100 | #245 | Tragic 22.3% |
| Liberians | 1.4 /100 | #246 | Tragic 22.4% |
Demographics Similar to Immigrants from Korea by Single Female Poverty
In terms of single female poverty, the demographic groups most similar to Immigrants from Korea are Immigrants from Eastern Asia (18.1%, a difference of 0.28%), Immigrants from China (18.1%, a difference of 0.32%), Iranian (18.0%, a difference of 0.60%), Indian (Asian) (17.9%, a difference of 0.76%), and Bolivian (17.9%, a difference of 0.90%).
| Demographics | Rating | Rank | Single Female Poverty |
| Immigrants | Ireland | 100.0 /100 | #10 | Exceptional 17.8% |
| Immigrants | Lithuania | 100.0 /100 | #11 | Exceptional 17.8% |
| Immigrants | South Central Asia | 100.0 /100 | #12 | Exceptional 17.8% |
| Immigrants | Bolivia | 100.0 /100 | #13 | Exceptional 17.8% |
| Bolivians | 100.0 /100 | #14 | Exceptional 17.9% |
| Indians (Asian) | 100.0 /100 | #15 | Exceptional 17.9% |
| Iranians | 100.0 /100 | #16 | Exceptional 18.0% |
| Immigrants | Korea | 100.0 /100 | #17 | Exceptional 18.1% |
| Immigrants | Eastern Asia | 100.0 /100 | #18 | Exceptional 18.1% |
| Immigrants | China | 100.0 /100 | #19 | Exceptional 18.1% |
| Immigrants | Greece | 100.0 /100 | #20 | Exceptional 18.3% |
| Maltese | 100.0 /100 | #21 | Exceptional 18.3% |
| Burmese | 100.0 /100 | #22 | Exceptional 18.3% |
| Asians | 100.0 /100 | #23 | Exceptional 18.3% |
| Armenians | 100.0 /100 | #24 | Exceptional 18.3% |