Lumbee vs Ute Single Male Poverty
COMPARE
Lumbee
Ute
Single Male Poverty
Single Male Poverty Comparison
Lumbee
Ute
25.2%
SINGLE MALE POVERTY
0.0/ 100
METRIC RATING
344th/ 347
METRIC RANK
15.7%
SINGLE MALE POVERTY
0.0/ 100
METRIC RATING
307th/ 347
METRIC RANK
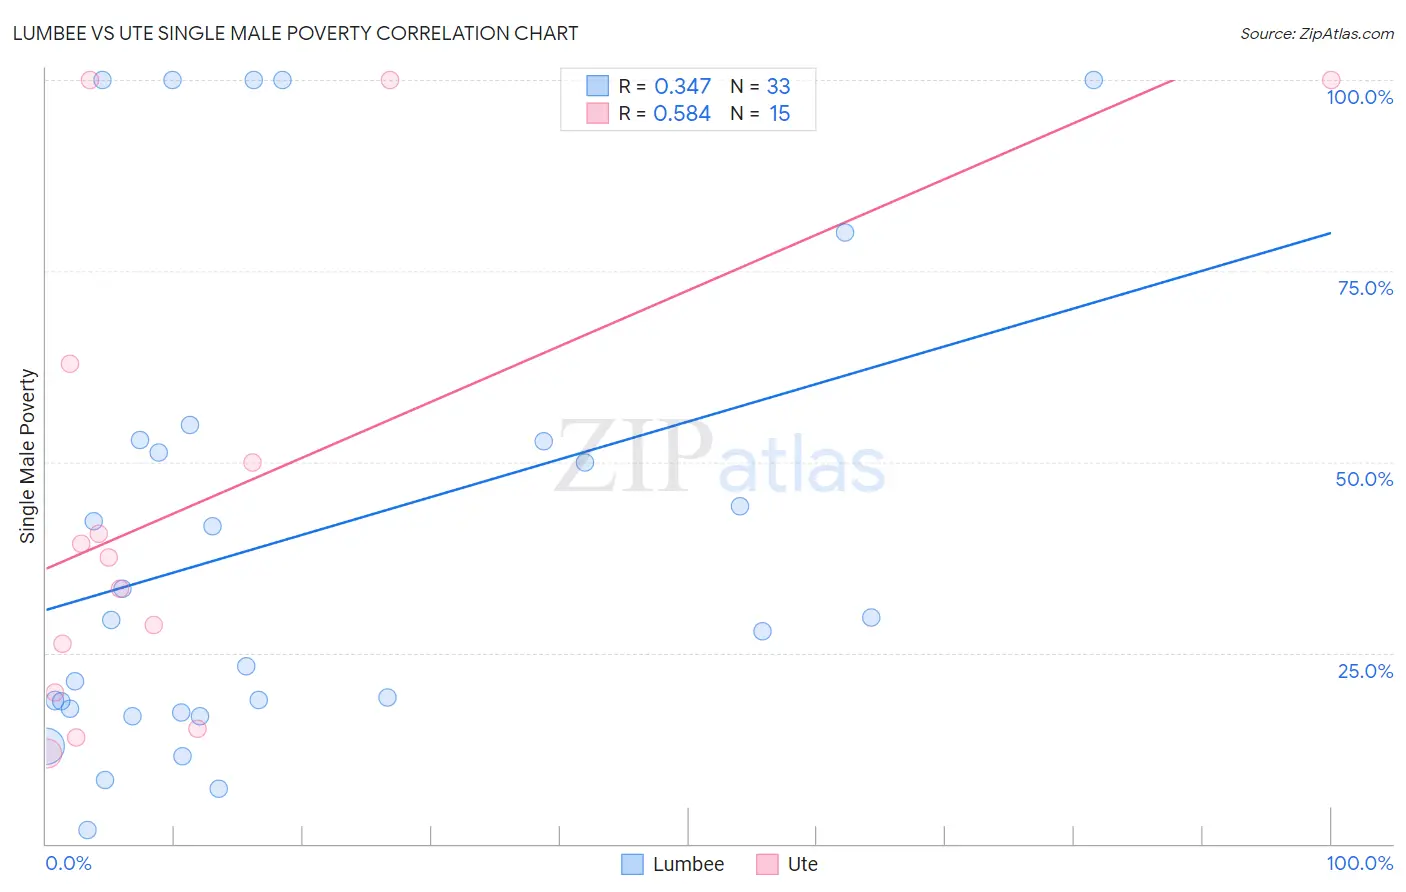
Lumbee vs Ute Single Male Poverty Correlation Chart
The statistical analysis conducted on geographies consisting of 87,687,707 people shows a mild positive correlation between the proportion of Lumbee and poverty level among single males in the United States with a correlation coefficient (R) of 0.347 and weighted average of 25.2%. Similarly, the statistical analysis conducted on geographies consisting of 54,243,903 people shows a substantial positive correlation between the proportion of Ute and poverty level among single males in the United States with a correlation coefficient (R) of 0.584 and weighted average of 15.7%, a difference of 60.4%.
Single Male Poverty Correlation Summary
| Measurement | Lumbee | Ute |
| Minimum | 1.9% | 11.8% |
| Maximum | 100.0% | 100.0% |
| Range | 98.1% | 88.2% |
| Mean | 40.0% | 45.2% |
| Median | 29.4% | 37.4% |
| Interquartile 25% (IQ1) | 17.5% | 19.9% |
| Interquartile 75% (IQ3) | 52.8% | 62.8% |
| Interquartile Range (IQR) | 35.4% | 42.9% |
| Standard Deviation (Sample) | 30.8% | 31.5% |
| Standard Deviation (Population) | 30.4% | 30.4% |
Similar Demographics by Single Male Poverty
Demographics Similar to Lumbee by Single Male Poverty
In terms of single male poverty, the demographic groups most similar to Lumbee are Puerto Rican (25.1%, a difference of 0.31%), Navajo (25.3%, a difference of 0.73%), Houma (23.5%, a difference of 7.3%), Crow (23.3%, a difference of 8.1%), and Hopi (27.5%, a difference of 9.3%).
| Demographics | Rating | Rank | Single Male Poverty |
| Inupiat | 0.0 /100 | #333 | Tragic 20.0% |
| Pima | 0.0 /100 | #334 | Tragic 20.2% |
| Yuman | 0.0 /100 | #335 | Tragic 21.3% |
| Tohono O'odham | 0.0 /100 | #336 | Tragic 21.6% |
| Apache | 0.0 /100 | #337 | Tragic 21.6% |
| Pueblo | 0.0 /100 | #338 | Tragic 21.6% |
| Arapaho | 0.0 /100 | #339 | Tragic 21.9% |
| Sioux | 0.0 /100 | #340 | Tragic 22.2% |
| Crow | 0.0 /100 | #341 | Tragic 23.3% |
| Houma | 0.0 /100 | #342 | Tragic 23.5% |
| Puerto Ricans | 0.0 /100 | #343 | Tragic 25.1% |
| Lumbee | 0.0 /100 | #344 | Tragic 25.2% |
| Navajo | 0.0 /100 | #345 | Tragic 25.3% |
| Hopi | 0.0 /100 | #346 | Tragic 27.5% |
| Yup'ik | 0.0 /100 | #347 | Tragic 31.6% |
Demographics Similar to Ute by Single Male Poverty
In terms of single male poverty, the demographic groups most similar to Ute are Potawatomi (15.8%, a difference of 0.57%), American (15.8%, a difference of 0.73%), Pennsylvania German (15.6%, a difference of 0.75%), Blackfeet (15.5%, a difference of 1.2%), and Yakama (15.9%, a difference of 1.6%).
| Demographics | Rating | Rank | Single Male Poverty |
| Cree | 0.0 /100 | #300 | Tragic 15.1% |
| Dominicans | 0.0 /100 | #301 | Tragic 15.2% |
| Alsatians | 0.0 /100 | #302 | Tragic 15.2% |
| Aleuts | 0.0 /100 | #303 | Tragic 15.4% |
| Alaska Natives | 0.0 /100 | #304 | Tragic 15.4% |
| Blackfeet | 0.0 /100 | #305 | Tragic 15.5% |
| Pennsylvania Germans | 0.0 /100 | #306 | Tragic 15.6% |
| Ute | 0.0 /100 | #307 | Tragic 15.7% |
| Potawatomi | 0.0 /100 | #308 | Tragic 15.8% |
| Americans | 0.0 /100 | #309 | Tragic 15.8% |
| Yakama | 0.0 /100 | #310 | Tragic 15.9% |
| Seminole | 0.0 /100 | #311 | Tragic 16.0% |
| Comanche | 0.0 /100 | #312 | Tragic 16.0% |
| Cherokee | 0.0 /100 | #313 | Tragic 16.1% |
| Alaskan Athabascans | 0.0 /100 | #314 | Tragic 16.1% |