Immigrants from Western Africa vs Ute Single Male Poverty
COMPARE
Immigrants from Western Africa
Ute
Single Male Poverty
Single Male Poverty Comparison
Immigrants from Western Africa
Ute
13.1%
SINGLE MALE POVERTY
17.6/ 100
METRIC RATING
208th/ 347
METRIC RANK
15.7%
SINGLE MALE POVERTY
0.0/ 100
METRIC RATING
307th/ 347
METRIC RANK
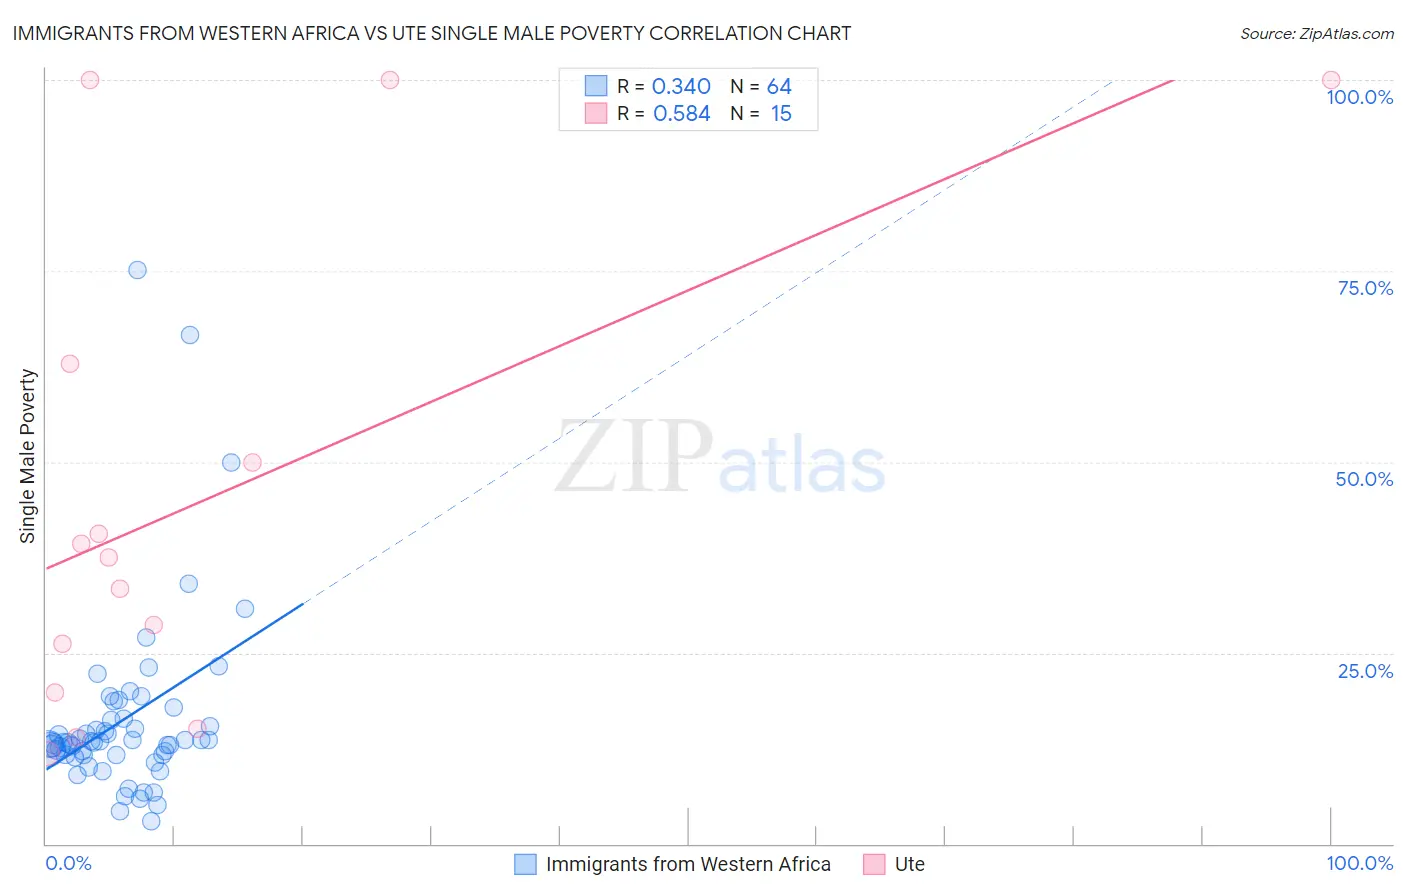
Immigrants from Western Africa vs Ute Single Male Poverty Correlation Chart
The statistical analysis conducted on geographies consisting of 322,395,283 people shows a mild positive correlation between the proportion of Immigrants from Western Africa and poverty level among single males in the United States with a correlation coefficient (R) of 0.340 and weighted average of 13.1%. Similarly, the statistical analysis conducted on geographies consisting of 54,243,903 people shows a substantial positive correlation between the proportion of Ute and poverty level among single males in the United States with a correlation coefficient (R) of 0.584 and weighted average of 15.7%, a difference of 20.1%.
Single Male Poverty Correlation Summary
| Measurement | Immigrants from Western Africa | Ute |
| Minimum | 2.9% | 11.8% |
| Maximum | 75.2% | 100.0% |
| Range | 72.3% | 88.2% |
| Mean | 16.2% | 45.2% |
| Median | 13.2% | 37.4% |
| Interquartile 25% (IQ1) | 11.6% | 19.9% |
| Interquartile 75% (IQ3) | 16.3% | 62.8% |
| Interquartile Range (IQR) | 4.7% | 42.9% |
| Standard Deviation (Sample) | 12.3% | 31.5% |
| Standard Deviation (Population) | 12.2% | 30.4% |
Similar Demographics by Single Male Poverty
Demographics Similar to Immigrants from Western Africa by Single Male Poverty
In terms of single male poverty, the demographic groups most similar to Immigrants from Western Africa are Sudanese (13.1%, a difference of 0.010%), Mexican American Indian (13.1%, a difference of 0.010%), Immigrants from Haiti (13.1%, a difference of 0.070%), Swedish (13.1%, a difference of 0.080%), and Northern European (13.0%, a difference of 0.11%).
| Demographics | Rating | Rank | Single Male Poverty |
| Trinidadians and Tobagonians | 21.4 /100 | #201 | Fair 13.0% |
| Basques | 20.7 /100 | #202 | Fair 13.0% |
| Immigrants | Bangladesh | 20.4 /100 | #203 | Fair 13.0% |
| Estonians | 20.3 /100 | #204 | Fair 13.0% |
| Poles | 19.3 /100 | #205 | Poor 13.0% |
| Northern Europeans | 18.9 /100 | #206 | Poor 13.0% |
| Sudanese | 17.7 /100 | #207 | Poor 13.1% |
| Immigrants | Western Africa | 17.6 /100 | #208 | Poor 13.1% |
| Mexican American Indians | 17.5 /100 | #209 | Poor 13.1% |
| Immigrants | Haiti | 16.8 /100 | #210 | Poor 13.1% |
| Swedes | 16.8 /100 | #211 | Poor 13.1% |
| Senegalese | 16.4 /100 | #212 | Poor 13.1% |
| Italians | 15.9 /100 | #213 | Poor 13.1% |
| Zimbabweans | 14.9 /100 | #214 | Poor 13.1% |
| Japanese | 14.8 /100 | #215 | Poor 13.1% |
Demographics Similar to Ute by Single Male Poverty
In terms of single male poverty, the demographic groups most similar to Ute are Potawatomi (15.8%, a difference of 0.57%), American (15.8%, a difference of 0.73%), Pennsylvania German (15.6%, a difference of 0.75%), Blackfeet (15.5%, a difference of 1.2%), and Yakama (15.9%, a difference of 1.6%).
| Demographics | Rating | Rank | Single Male Poverty |
| Cree | 0.0 /100 | #300 | Tragic 15.1% |
| Dominicans | 0.0 /100 | #301 | Tragic 15.2% |
| Alsatians | 0.0 /100 | #302 | Tragic 15.2% |
| Aleuts | 0.0 /100 | #303 | Tragic 15.4% |
| Alaska Natives | 0.0 /100 | #304 | Tragic 15.4% |
| Blackfeet | 0.0 /100 | #305 | Tragic 15.5% |
| Pennsylvania Germans | 0.0 /100 | #306 | Tragic 15.6% |
| Ute | 0.0 /100 | #307 | Tragic 15.7% |
| Potawatomi | 0.0 /100 | #308 | Tragic 15.8% |
| Americans | 0.0 /100 | #309 | Tragic 15.8% |
| Yakama | 0.0 /100 | #310 | Tragic 15.9% |
| Seminole | 0.0 /100 | #311 | Tragic 16.0% |
| Comanche | 0.0 /100 | #312 | Tragic 16.0% |
| Cherokee | 0.0 /100 | #313 | Tragic 16.1% |
| Alaskan Athabascans | 0.0 /100 | #314 | Tragic 16.1% |