Immigrants from El Salvador vs Ute Single Male Poverty
COMPARE
Immigrants from El Salvador
Ute
Single Male Poverty
Single Male Poverty Comparison
Immigrants from El Salvador
Ute
12.6%
SINGLE MALE POVERTY
80.0/ 100
METRIC RATING
138th/ 347
METRIC RANK
15.7%
SINGLE MALE POVERTY
0.0/ 100
METRIC RATING
307th/ 347
METRIC RANK
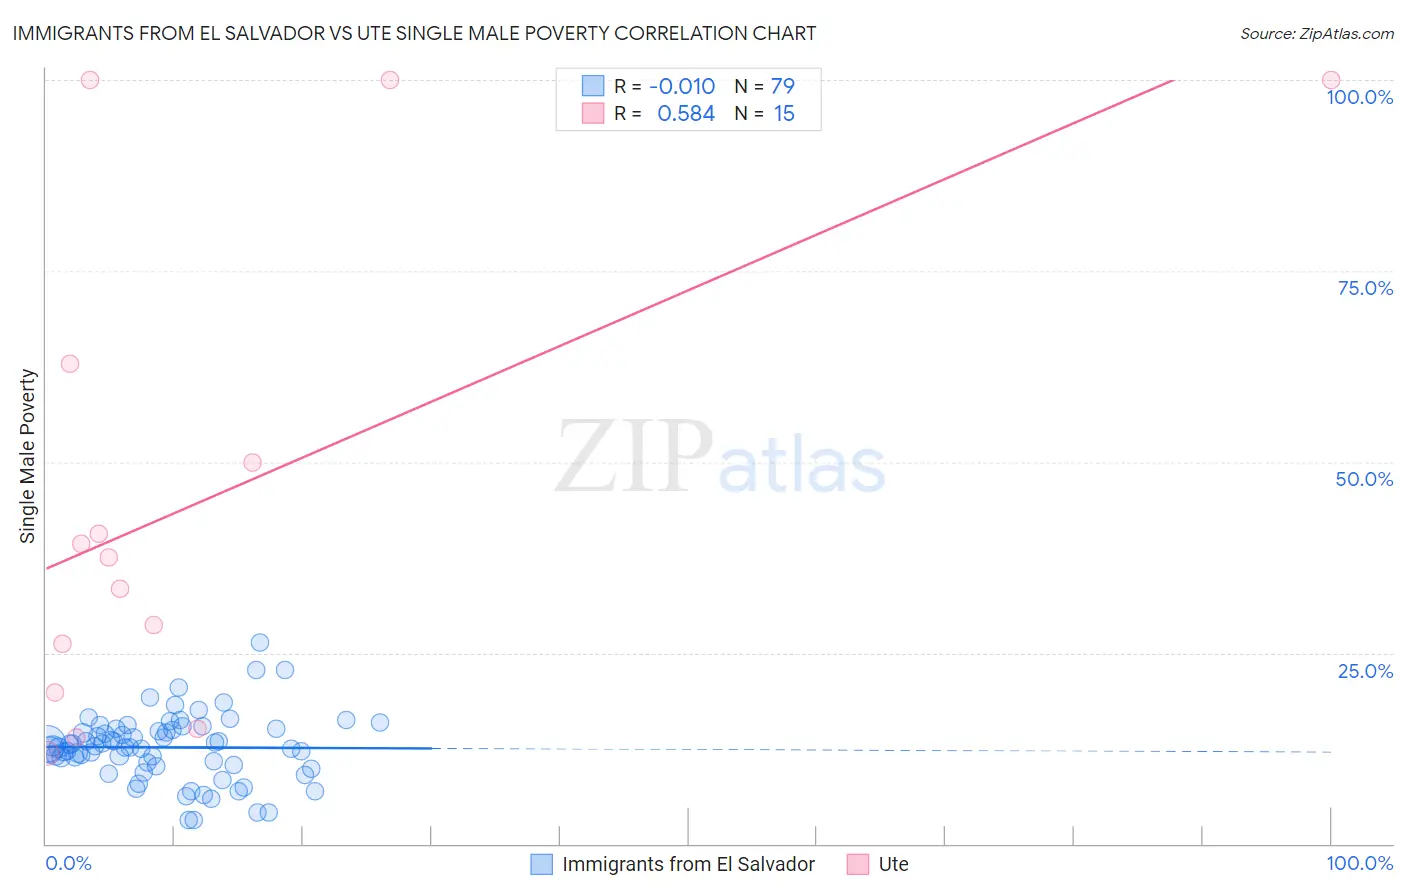
Immigrants from El Salvador vs Ute Single Male Poverty Correlation Chart
The statistical analysis conducted on geographies consisting of 325,623,225 people shows no correlation between the proportion of Immigrants from El Salvador and poverty level among single males in the United States with a correlation coefficient (R) of -0.010 and weighted average of 12.6%. Similarly, the statistical analysis conducted on geographies consisting of 54,243,903 people shows a substantial positive correlation between the proportion of Ute and poverty level among single males in the United States with a correlation coefficient (R) of 0.584 and weighted average of 15.7%, a difference of 24.8%.
Single Male Poverty Correlation Summary
| Measurement | Immigrants from El Salvador | Ute |
| Minimum | 3.1% | 11.8% |
| Maximum | 26.3% | 100.0% |
| Range | 23.3% | 88.2% |
| Mean | 12.6% | 45.2% |
| Median | 12.8% | 37.4% |
| Interquartile 25% (IQ1) | 10.3% | 19.9% |
| Interquartile 75% (IQ3) | 15.1% | 62.8% |
| Interquartile Range (IQR) | 4.7% | 42.9% |
| Standard Deviation (Sample) | 4.3% | 31.5% |
| Standard Deviation (Population) | 4.3% | 30.4% |
Similar Demographics by Single Male Poverty
Demographics Similar to Immigrants from El Salvador by Single Male Poverty
In terms of single male poverty, the demographic groups most similar to Immigrants from El Salvador are Cuban (12.6%, a difference of 0.010%), Ukrainian (12.6%, a difference of 0.060%), Immigrants from Costa Rica (12.5%, a difference of 0.16%), Immigrants from Austria (12.5%, a difference of 0.16%), and Immigrants from Zimbabwe (12.6%, a difference of 0.16%).
| Demographics | Rating | Rank | Single Male Poverty |
| Immigrants | Northern Europe | 83.7 /100 | #131 | Excellent 12.5% |
| Salvadorans | 83.7 /100 | #132 | Excellent 12.5% |
| Immigrants | Western Asia | 83.4 /100 | #133 | Excellent 12.5% |
| Immigrants | Ecuador | 82.1 /100 | #134 | Excellent 12.5% |
| Immigrants | Costa Rica | 81.9 /100 | #135 | Excellent 12.5% |
| Immigrants | Austria | 81.9 /100 | #136 | Excellent 12.5% |
| Ukrainians | 80.7 /100 | #137 | Excellent 12.6% |
| Immigrants | El Salvador | 80.0 /100 | #138 | Excellent 12.6% |
| Cubans | 79.9 /100 | #139 | Good 12.6% |
| Immigrants | Zimbabwe | 78.0 /100 | #140 | Good 12.6% |
| Okinawans | 75.9 /100 | #141 | Good 12.6% |
| Immigrants | Uganda | 75.9 /100 | #142 | Good 12.6% |
| Immigrants | France | 75.8 /100 | #143 | Good 12.6% |
| Hawaiians | 75.1 /100 | #144 | Good 12.6% |
| Immigrants | Lebanon | 75.0 /100 | #145 | Good 12.6% |
Demographics Similar to Ute by Single Male Poverty
In terms of single male poverty, the demographic groups most similar to Ute are Potawatomi (15.8%, a difference of 0.57%), American (15.8%, a difference of 0.73%), Pennsylvania German (15.6%, a difference of 0.75%), Blackfeet (15.5%, a difference of 1.2%), and Yakama (15.9%, a difference of 1.6%).
| Demographics | Rating | Rank | Single Male Poverty |
| Cree | 0.0 /100 | #300 | Tragic 15.1% |
| Dominicans | 0.0 /100 | #301 | Tragic 15.2% |
| Alsatians | 0.0 /100 | #302 | Tragic 15.2% |
| Aleuts | 0.0 /100 | #303 | Tragic 15.4% |
| Alaska Natives | 0.0 /100 | #304 | Tragic 15.4% |
| Blackfeet | 0.0 /100 | #305 | Tragic 15.5% |
| Pennsylvania Germans | 0.0 /100 | #306 | Tragic 15.6% |
| Ute | 0.0 /100 | #307 | Tragic 15.7% |
| Potawatomi | 0.0 /100 | #308 | Tragic 15.8% |
| Americans | 0.0 /100 | #309 | Tragic 15.8% |
| Yakama | 0.0 /100 | #310 | Tragic 15.9% |
| Seminole | 0.0 /100 | #311 | Tragic 16.0% |
| Comanche | 0.0 /100 | #312 | Tragic 16.0% |
| Cherokee | 0.0 /100 | #313 | Tragic 16.1% |
| Alaskan Athabascans | 0.0 /100 | #314 | Tragic 16.1% |