Lumbee vs Hmong Male Poverty
COMPARE
Lumbee
Hmong
Male Poverty
Male Poverty Comparison
Lumbee
Hmong
20.2%
MALE POVERTY
0.0/ 100
METRIC RATING
341st/ 347
METRIC RANK
11.6%
MALE POVERTY
15.8/ 100
METRIC RATING
196th/ 347
METRIC RANK
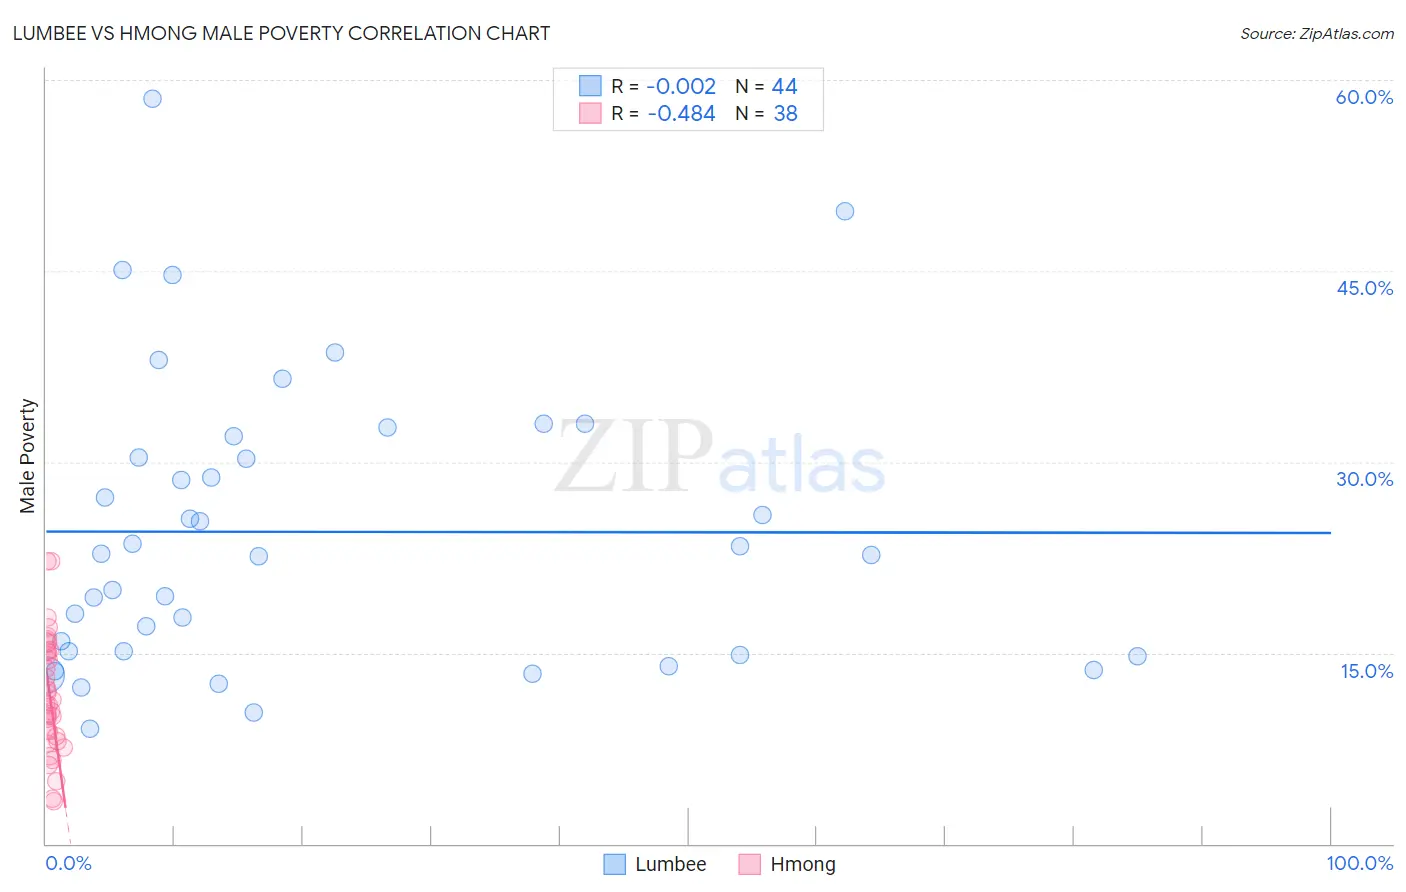
Lumbee vs Hmong Male Poverty Correlation Chart
The statistical analysis conducted on geographies consisting of 92,248,821 people shows no correlation between the proportion of Lumbee and poverty level among males in the United States with a correlation coefficient (R) of -0.002 and weighted average of 20.2%. Similarly, the statistical analysis conducted on geographies consisting of 24,672,093 people shows a moderate negative correlation between the proportion of Hmong and poverty level among males in the United States with a correlation coefficient (R) of -0.484 and weighted average of 11.6%, a difference of 73.5%.
Male Poverty Correlation Summary
| Measurement | Lumbee | Hmong |
| Minimum | 9.1% | 3.4% |
| Maximum | 58.5% | 22.2% |
| Range | 49.5% | 18.8% |
| Mean | 24.5% | 11.7% |
| Median | 22.7% | 11.1% |
| Interquartile 25% (IQ1) | 15.0% | 8.4% |
| Interquartile 75% (IQ3) | 31.2% | 15.1% |
| Interquartile Range (IQR) | 16.2% | 6.7% |
| Standard Deviation (Sample) | 11.3% | 4.5% |
| Standard Deviation (Population) | 11.2% | 4.5% |
Similar Demographics by Male Poverty
Demographics Similar to Lumbee by Male Poverty
In terms of male poverty, the demographic groups most similar to Lumbee are Immigrants from Yemen (20.1%, a difference of 0.30%), Pima (20.4%, a difference of 0.78%), Yup'ik (20.4%, a difference of 0.88%), Hopi (20.8%, a difference of 3.0%), and Yuman (19.5%, a difference of 3.4%).
| Demographics | Rating | Rank | Male Poverty |
| Natives/Alaskans | 0.0 /100 | #333 | Tragic 16.9% |
| Cheyenne | 0.0 /100 | #334 | Tragic 17.6% |
| Apache | 0.0 /100 | #335 | Tragic 17.7% |
| Pueblo | 0.0 /100 | #336 | Tragic 18.5% |
| Sioux | 0.0 /100 | #337 | Tragic 18.7% |
| Crow | 0.0 /100 | #338 | Tragic 19.1% |
| Yuman | 0.0 /100 | #339 | Tragic 19.5% |
| Immigrants | Yemen | 0.0 /100 | #340 | Tragic 20.1% |
| Lumbee | 0.0 /100 | #341 | Tragic 20.2% |
| Pima | 0.0 /100 | #342 | Tragic 20.4% |
| Yup'ik | 0.0 /100 | #343 | Tragic 20.4% |
| Hopi | 0.0 /100 | #344 | Tragic 20.8% |
| Puerto Ricans | 0.0 /100 | #345 | Tragic 22.0% |
| Navajo | 0.0 /100 | #346 | Tragic 22.3% |
| Tohono O'odham | 0.0 /100 | #347 | Tragic 22.9% |
Demographics Similar to Hmong by Male Poverty
In terms of male poverty, the demographic groups most similar to Hmong are Arab (11.6%, a difference of 0.010%), Immigrants from Kenya (11.6%, a difference of 0.050%), Delaware (11.7%, a difference of 0.060%), Iraqi (11.7%, a difference of 0.20%), and Immigrants from Kuwait (11.6%, a difference of 0.27%).
| Demographics | Rating | Rank | Male Poverty |
| Hawaiians | 28.3 /100 | #189 | Fair 11.4% |
| Israelis | 26.1 /100 | #190 | Fair 11.5% |
| South American Indians | 22.8 /100 | #191 | Fair 11.5% |
| Immigrants | Uruguay | 19.1 /100 | #192 | Poor 11.6% |
| Immigrants | Kuwait | 17.3 /100 | #193 | Poor 11.6% |
| Immigrants | Kenya | 16.1 /100 | #194 | Poor 11.6% |
| Arabs | 15.8 /100 | #195 | Poor 11.6% |
| Hmong | 15.8 /100 | #196 | Poor 11.6% |
| Delaware | 15.4 /100 | #197 | Poor 11.7% |
| Iraqis | 14.7 /100 | #198 | Poor 11.7% |
| Spanish | 14.1 /100 | #199 | Poor 11.7% |
| Immigrants | Lebanon | 13.6 /100 | #200 | Poor 11.7% |
| Spaniards | 13.5 /100 | #201 | Poor 11.7% |
| Aleuts | 10.4 /100 | #202 | Poor 11.8% |
| Immigrants | Western Asia | 9.8 /100 | #203 | Tragic 11.8% |