Nicaraguan vs Hmong Male Poverty
COMPARE
Nicaraguan
Hmong
Male Poverty
Male Poverty Comparison
Nicaraguans
Hmong
12.6%
MALE POVERTY
0.6/ 100
METRIC RATING
232nd/ 347
METRIC RANK
11.6%
MALE POVERTY
15.8/ 100
METRIC RATING
196th/ 347
METRIC RANK
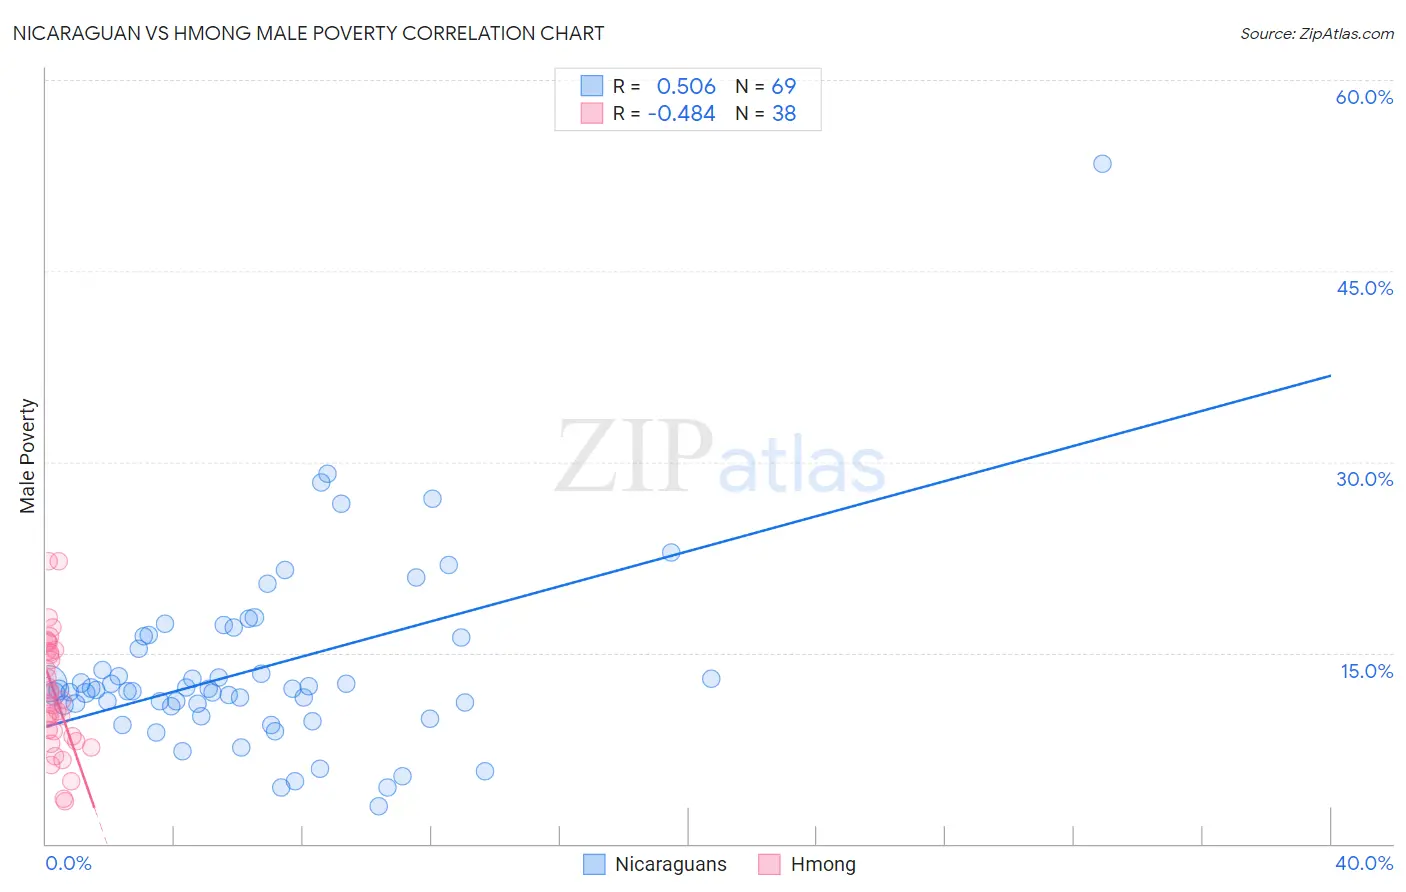
Nicaraguan vs Hmong Male Poverty Correlation Chart
The statistical analysis conducted on geographies consisting of 285,585,810 people shows a substantial positive correlation between the proportion of Nicaraguans and poverty level among males in the United States with a correlation coefficient (R) of 0.506 and weighted average of 12.6%. Similarly, the statistical analysis conducted on geographies consisting of 24,672,093 people shows a moderate negative correlation between the proportion of Hmong and poverty level among males in the United States with a correlation coefficient (R) of -0.484 and weighted average of 11.6%, a difference of 8.0%.
Male Poverty Correlation Summary
| Measurement | Nicaraguan | Hmong |
| Minimum | 2.9% | 3.4% |
| Maximum | 53.4% | 22.2% |
| Range | 50.5% | 18.8% |
| Mean | 13.7% | 11.7% |
| Median | 12.1% | 11.1% |
| Interquartile 25% (IQ1) | 10.9% | 8.4% |
| Interquartile 75% (IQ3) | 16.3% | 15.1% |
| Interquartile Range (IQR) | 5.4% | 6.7% |
| Standard Deviation (Sample) | 7.3% | 4.5% |
| Standard Deviation (Population) | 7.3% | 4.5% |
Similar Demographics by Male Poverty
Demographics Similar to Nicaraguans by Male Poverty
In terms of male poverty, the demographic groups most similar to Nicaraguans are Fijian (12.6%, a difference of 0.050%), Immigrants from Armenia (12.6%, a difference of 0.11%), Salvadoran (12.6%, a difference of 0.12%), Immigrants from Laos (12.6%, a difference of 0.47%), and Marshallese (12.5%, a difference of 0.68%).
| Demographics | Rating | Rank | Male Poverty |
| Osage | 1.5 /100 | #225 | Tragic 12.3% |
| Nigerians | 1.4 /100 | #226 | Tragic 12.3% |
| Alaska Natives | 1.4 /100 | #227 | Tragic 12.4% |
| Alsatians | 1.3 /100 | #228 | Tragic 12.4% |
| Cubans | 1.3 /100 | #229 | Tragic 12.4% |
| Marshallese | 0.8 /100 | #230 | Tragic 12.5% |
| Salvadorans | 0.6 /100 | #231 | Tragic 12.6% |
| Nicaraguans | 0.6 /100 | #232 | Tragic 12.6% |
| Fijians | 0.6 /100 | #233 | Tragic 12.6% |
| Immigrants | Armenia | 0.6 /100 | #234 | Tragic 12.6% |
| Immigrants | Laos | 0.5 /100 | #235 | Tragic 12.6% |
| Immigrants | Saudi Arabia | 0.4 /100 | #236 | Tragic 12.7% |
| French American Indians | 0.4 /100 | #237 | Tragic 12.7% |
| Ecuadorians | 0.4 /100 | #238 | Tragic 12.7% |
| Ghanaians | 0.4 /100 | #239 | Tragic 12.7% |
Demographics Similar to Hmong by Male Poverty
In terms of male poverty, the demographic groups most similar to Hmong are Arab (11.6%, a difference of 0.010%), Immigrants from Kenya (11.6%, a difference of 0.050%), Delaware (11.7%, a difference of 0.060%), Iraqi (11.7%, a difference of 0.20%), and Immigrants from Kuwait (11.6%, a difference of 0.27%).
| Demographics | Rating | Rank | Male Poverty |
| Hawaiians | 28.3 /100 | #189 | Fair 11.4% |
| Israelis | 26.1 /100 | #190 | Fair 11.5% |
| South American Indians | 22.8 /100 | #191 | Fair 11.5% |
| Immigrants | Uruguay | 19.1 /100 | #192 | Poor 11.6% |
| Immigrants | Kuwait | 17.3 /100 | #193 | Poor 11.6% |
| Immigrants | Kenya | 16.1 /100 | #194 | Poor 11.6% |
| Arabs | 15.8 /100 | #195 | Poor 11.6% |
| Hmong | 15.8 /100 | #196 | Poor 11.6% |
| Delaware | 15.4 /100 | #197 | Poor 11.7% |
| Iraqis | 14.7 /100 | #198 | Poor 11.7% |
| Spanish | 14.1 /100 | #199 | Poor 11.7% |
| Immigrants | Lebanon | 13.6 /100 | #200 | Poor 11.7% |
| Spaniards | 13.5 /100 | #201 | Poor 11.7% |
| Aleuts | 10.4 /100 | #202 | Poor 11.8% |
| Immigrants | Western Asia | 9.8 /100 | #203 | Tragic 11.8% |