Lumbee vs Immigrants from Caribbean Male Poverty
COMPARE
Lumbee
Immigrants from Caribbean
Male Poverty
Male Poverty Comparison
Lumbee
Immigrants from Caribbean
20.2%
MALE POVERTY
0.0/ 100
METRIC RATING
341st/ 347
METRIC RANK
14.0%
MALE POVERTY
0.0/ 100
METRIC RATING
302nd/ 347
METRIC RANK
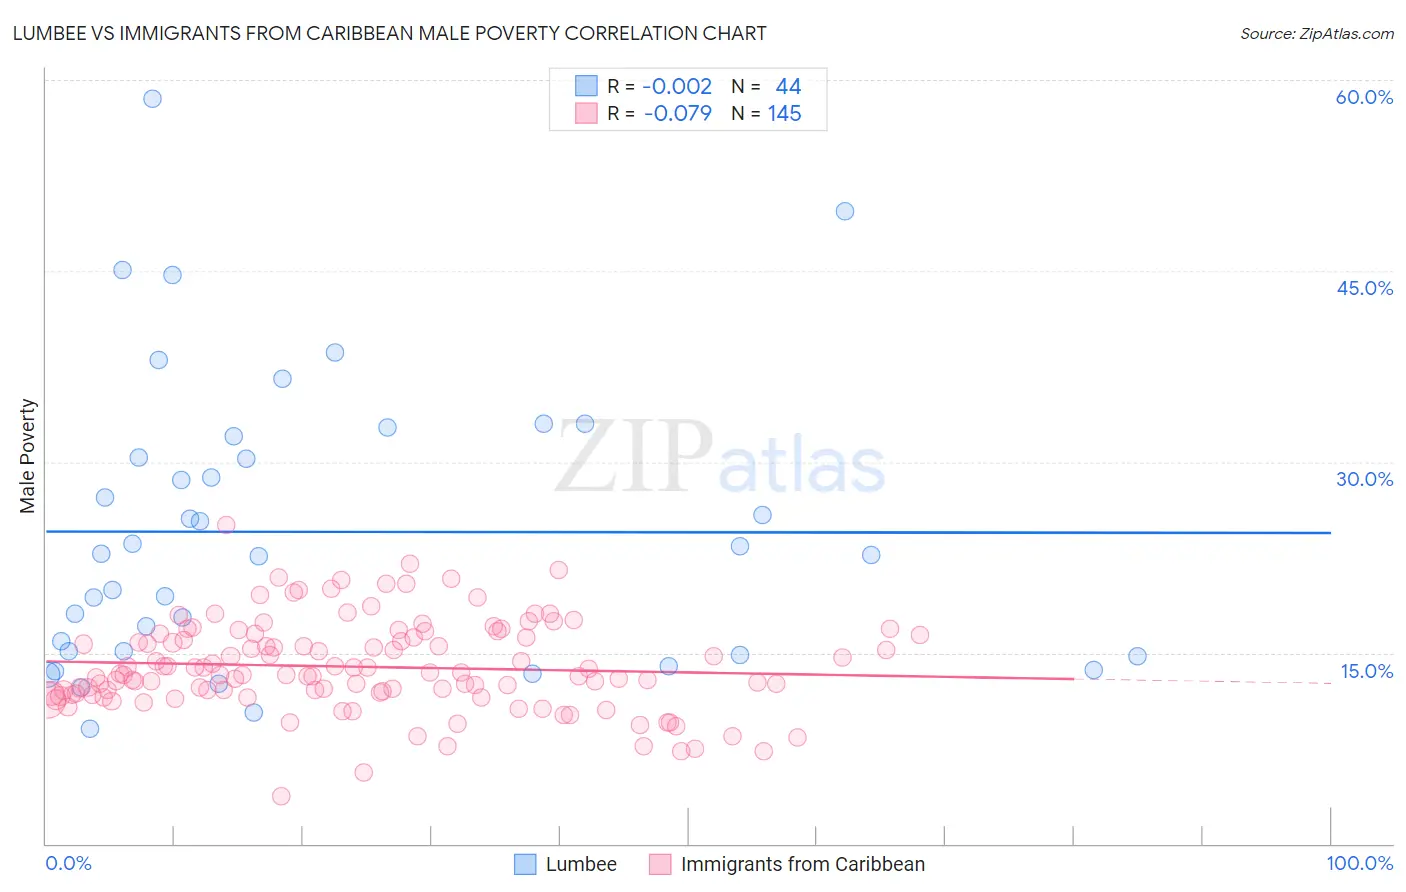
Lumbee vs Immigrants from Caribbean Male Poverty Correlation Chart
The statistical analysis conducted on geographies consisting of 92,248,821 people shows no correlation between the proportion of Lumbee and poverty level among males in the United States with a correlation coefficient (R) of -0.002 and weighted average of 20.2%. Similarly, the statistical analysis conducted on geographies consisting of 449,415,069 people shows a slight negative correlation between the proportion of Immigrants from Caribbean and poverty level among males in the United States with a correlation coefficient (R) of -0.079 and weighted average of 14.0%, a difference of 43.9%.
Male Poverty Correlation Summary
| Measurement | Lumbee | Immigrants from Caribbean |
| Minimum | 9.1% | 3.7% |
| Maximum | 58.5% | 25.0% |
| Range | 49.5% | 21.3% |
| Mean | 24.5% | 13.9% |
| Median | 22.7% | 13.3% |
| Interquartile 25% (IQ1) | 15.0% | 11.8% |
| Interquartile 75% (IQ3) | 31.2% | 16.3% |
| Interquartile Range (IQR) | 16.2% | 4.5% |
| Standard Deviation (Sample) | 11.3% | 3.5% |
| Standard Deviation (Population) | 11.2% | 3.5% |
Similar Demographics by Male Poverty
Demographics Similar to Lumbee by Male Poverty
In terms of male poverty, the demographic groups most similar to Lumbee are Immigrants from Yemen (20.1%, a difference of 0.30%), Pima (20.4%, a difference of 0.78%), Yup'ik (20.4%, a difference of 0.88%), Hopi (20.8%, a difference of 3.0%), and Yuman (19.5%, a difference of 3.4%).
| Demographics | Rating | Rank | Male Poverty |
| Natives/Alaskans | 0.0 /100 | #333 | Tragic 16.9% |
| Cheyenne | 0.0 /100 | #334 | Tragic 17.6% |
| Apache | 0.0 /100 | #335 | Tragic 17.7% |
| Pueblo | 0.0 /100 | #336 | Tragic 18.5% |
| Sioux | 0.0 /100 | #337 | Tragic 18.7% |
| Crow | 0.0 /100 | #338 | Tragic 19.1% |
| Yuman | 0.0 /100 | #339 | Tragic 19.5% |
| Immigrants | Yemen | 0.0 /100 | #340 | Tragic 20.1% |
| Lumbee | 0.0 /100 | #341 | Tragic 20.2% |
| Pima | 0.0 /100 | #342 | Tragic 20.4% |
| Yup'ik | 0.0 /100 | #343 | Tragic 20.4% |
| Hopi | 0.0 /100 | #344 | Tragic 20.8% |
| Puerto Ricans | 0.0 /100 | #345 | Tragic 22.0% |
| Navajo | 0.0 /100 | #346 | Tragic 22.3% |
| Tohono O'odham | 0.0 /100 | #347 | Tragic 22.9% |
Demographics Similar to Immigrants from Caribbean by Male Poverty
In terms of male poverty, the demographic groups most similar to Immigrants from Caribbean are Bahamian (14.1%, a difference of 0.040%), Immigrants from Senegal (14.0%, a difference of 0.060%), Immigrants from Mexico (14.0%, a difference of 0.13%), Senegalese (14.1%, a difference of 0.14%), and Immigrants from Guatemala (14.0%, a difference of 0.24%).
| Demographics | Rating | Rank | Male Poverty |
| Immigrants | Central America | 0.0 /100 | #295 | Tragic 13.9% |
| Cajuns | 0.0 /100 | #296 | Tragic 13.9% |
| Inupiat | 0.0 /100 | #297 | Tragic 14.0% |
| Blackfeet | 0.0 /100 | #298 | Tragic 14.0% |
| Immigrants | Guatemala | 0.0 /100 | #299 | Tragic 14.0% |
| Immigrants | Mexico | 0.0 /100 | #300 | Tragic 14.0% |
| Immigrants | Senegal | 0.0 /100 | #301 | Tragic 14.0% |
| Immigrants | Caribbean | 0.0 /100 | #302 | Tragic 14.0% |
| Bahamians | 0.0 /100 | #303 | Tragic 14.1% |
| Senegalese | 0.0 /100 | #304 | Tragic 14.1% |
| Immigrants | Bangladesh | 0.0 /100 | #305 | Tragic 14.1% |
| Creek | 0.0 /100 | #306 | Tragic 14.1% |
| Dutch West Indians | 0.0 /100 | #307 | Tragic 14.2% |
| Africans | 0.0 /100 | #308 | Tragic 14.2% |
| Somalis | 0.0 /100 | #309 | Tragic 14.3% |