Immigrants from Uzbekistan vs Hmong Male Poverty
COMPARE
Immigrants from Uzbekistan
Hmong
Male Poverty
Male Poverty Comparison
Immigrants from Uzbekistan
Hmong
12.2%
MALE POVERTY
2.6/ 100
METRIC RATING
215th/ 347
METRIC RANK
11.6%
MALE POVERTY
15.8/ 100
METRIC RATING
196th/ 347
METRIC RANK
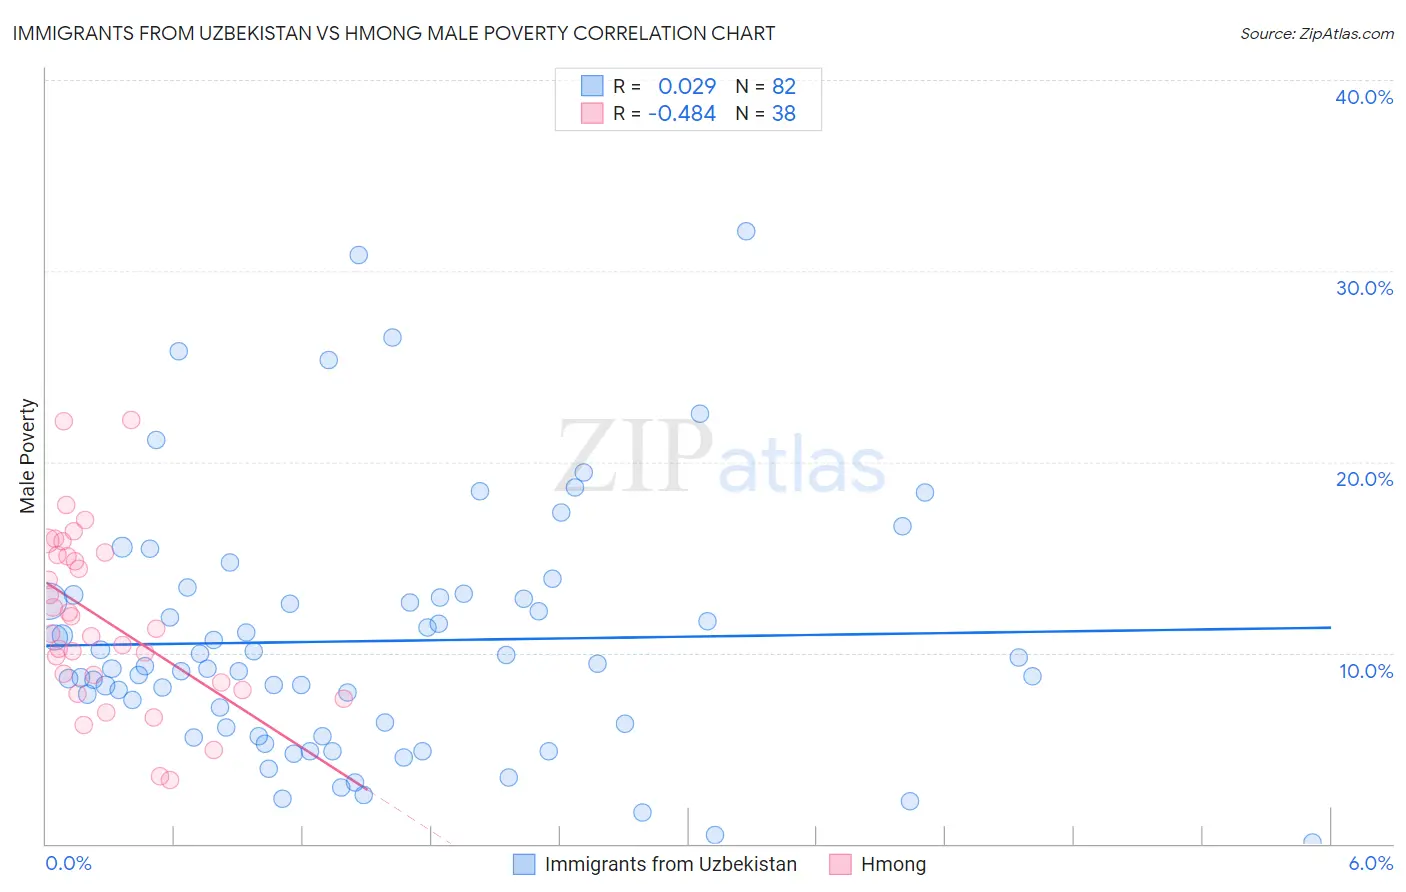
Immigrants from Uzbekistan vs Hmong Male Poverty Correlation Chart
The statistical analysis conducted on geographies consisting of 118,712,457 people shows no correlation between the proportion of Immigrants from Uzbekistan and poverty level among males in the United States with a correlation coefficient (R) of 0.029 and weighted average of 12.2%. Similarly, the statistical analysis conducted on geographies consisting of 24,672,093 people shows a moderate negative correlation between the proportion of Hmong and poverty level among males in the United States with a correlation coefficient (R) of -0.484 and weighted average of 11.6%, a difference of 4.6%.
Male Poverty Correlation Summary
| Measurement | Immigrants from Uzbekistan | Hmong |
| Minimum | 0.066% | 3.4% |
| Maximum | 32.1% | 22.2% |
| Range | 32.0% | 18.8% |
| Mean | 10.6% | 11.7% |
| Median | 9.2% | 11.1% |
| Interquartile 25% (IQ1) | 6.1% | 8.4% |
| Interquartile 75% (IQ3) | 12.9% | 15.1% |
| Interquartile Range (IQR) | 6.9% | 6.7% |
| Standard Deviation (Sample) | 6.5% | 4.5% |
| Standard Deviation (Population) | 6.5% | 4.5% |
Demographics Similar to Immigrants from Uzbekistan and Hmong by Male Poverty
In terms of male poverty, the demographic groups most similar to Immigrants from Uzbekistan are Japanese (12.2%, a difference of 0.12%), Nonimmigrants (12.1%, a difference of 0.43%), American (12.1%, a difference of 0.47%), Immigrants from Panama (12.1%, a difference of 1.0%), and Moroccan (12.0%, a difference of 1.2%). Similarly, the demographic groups most similar to Hmong are Arab (11.6%, a difference of 0.010%), Delaware (11.7%, a difference of 0.060%), Iraqi (11.7%, a difference of 0.20%), Spanish (11.7%, a difference of 0.31%), and Immigrants from Lebanon (11.7%, a difference of 0.41%).
| Demographics | Rating | Rank | Male Poverty |
| Arabs | 15.8 /100 | #195 | Poor 11.6% |
| Hmong | 15.8 /100 | #196 | Poor 11.6% |
| Delaware | 15.4 /100 | #197 | Poor 11.7% |
| Iraqis | 14.7 /100 | #198 | Poor 11.7% |
| Spanish | 14.1 /100 | #199 | Poor 11.7% |
| Immigrants | Lebanon | 13.6 /100 | #200 | Poor 11.7% |
| Spaniards | 13.5 /100 | #201 | Poor 11.7% |
| Aleuts | 10.4 /100 | #202 | Poor 11.8% |
| Immigrants | Western Asia | 9.8 /100 | #203 | Tragic 11.8% |
| Immigrants | Uganda | 8.5 /100 | #204 | Tragic 11.8% |
| Panamanians | 6.2 /100 | #205 | Tragic 11.9% |
| Immigrants | Eastern Africa | 5.4 /100 | #206 | Tragic 12.0% |
| Malaysians | 5.2 /100 | #207 | Tragic 12.0% |
| Immigrants | Immigrants | 4.5 /100 | #208 | Tragic 12.0% |
| Immigrants | Azores | 4.3 /100 | #209 | Tragic 12.0% |
| Moroccans | 4.2 /100 | #210 | Tragic 12.0% |
| Immigrants | Panama | 4.0 /100 | #211 | Tragic 12.1% |
| Americans | 3.2 /100 | #212 | Tragic 12.1% |
| Immigrants | Nonimmigrants | 3.1 /100 | #213 | Tragic 12.1% |
| Japanese | 2.7 /100 | #214 | Tragic 12.2% |
| Immigrants | Uzbekistan | 2.6 /100 | #215 | Tragic 12.2% |