Lumbee vs Croatian Male Poverty
COMPARE
Lumbee
Croatian
Male Poverty
Male Poverty Comparison
Lumbee
Croatians
20.2%
MALE POVERTY
0.0/ 100
METRIC RATING
341st/ 347
METRIC RANK
9.6%
MALE POVERTY
99.7/ 100
METRIC RATING
22nd/ 347
METRIC RANK
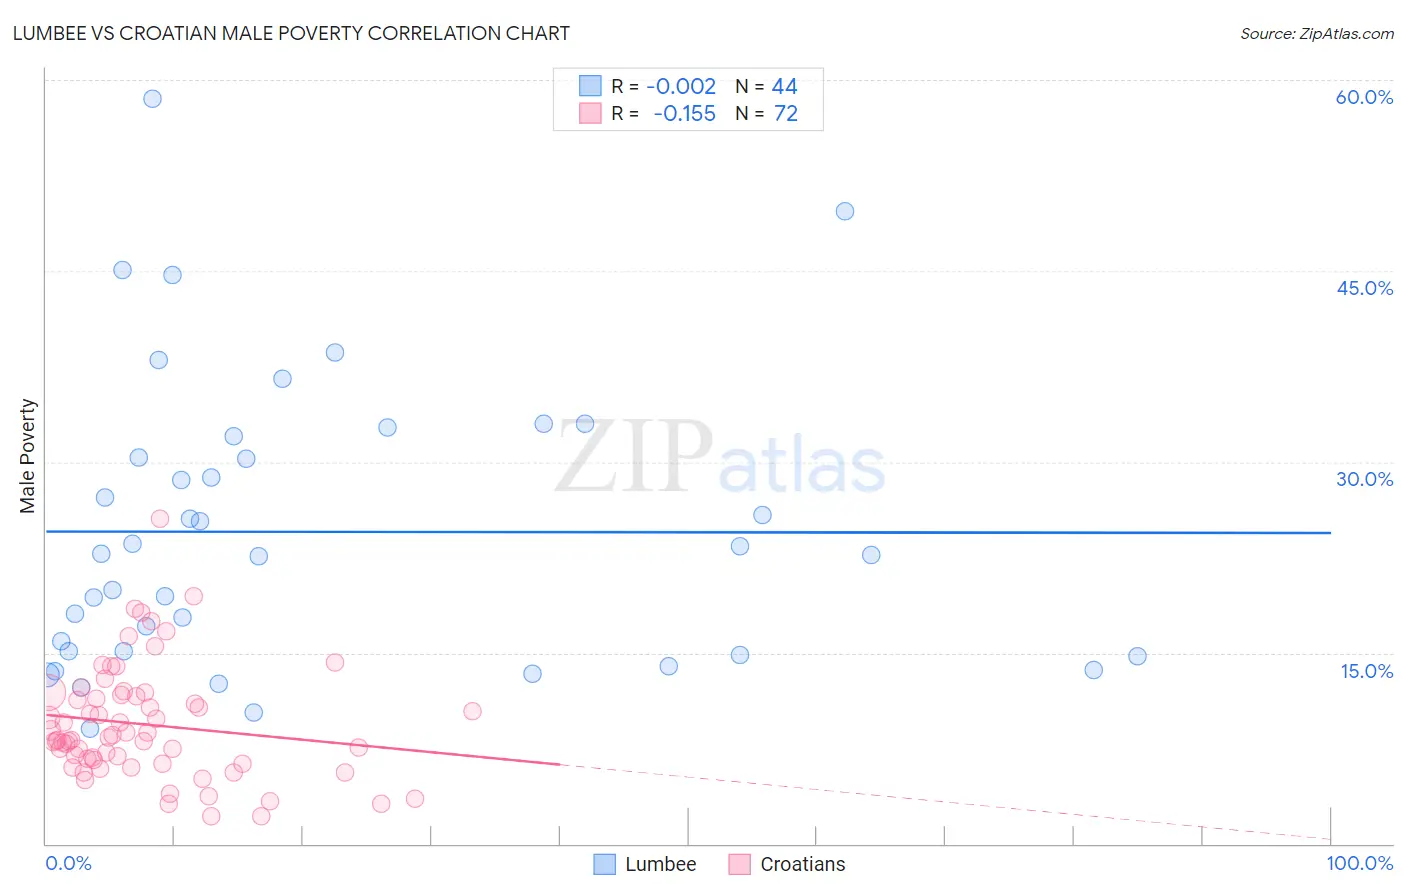
Lumbee vs Croatian Male Poverty Correlation Chart
The statistical analysis conducted on geographies consisting of 92,248,821 people shows no correlation between the proportion of Lumbee and poverty level among males in the United States with a correlation coefficient (R) of -0.002 and weighted average of 20.2%. Similarly, the statistical analysis conducted on geographies consisting of 375,378,387 people shows a poor negative correlation between the proportion of Croatians and poverty level among males in the United States with a correlation coefficient (R) of -0.155 and weighted average of 9.6%, a difference of 110.1%.
Male Poverty Correlation Summary
| Measurement | Lumbee | Croatian |
| Minimum | 9.1% | 2.1% |
| Maximum | 58.5% | 25.5% |
| Range | 49.5% | 23.4% |
| Mean | 24.5% | 9.4% |
| Median | 22.7% | 8.2% |
| Interquartile 25% (IQ1) | 15.0% | 6.5% |
| Interquartile 75% (IQ3) | 31.2% | 11.6% |
| Interquartile Range (IQR) | 16.2% | 5.2% |
| Standard Deviation (Sample) | 11.3% | 4.4% |
| Standard Deviation (Population) | 11.2% | 4.4% |
Similar Demographics by Male Poverty
Demographics Similar to Lumbee by Male Poverty
In terms of male poverty, the demographic groups most similar to Lumbee are Immigrants from Yemen (20.1%, a difference of 0.30%), Pima (20.4%, a difference of 0.78%), Yup'ik (20.4%, a difference of 0.88%), Hopi (20.8%, a difference of 3.0%), and Yuman (19.5%, a difference of 3.4%).
| Demographics | Rating | Rank | Male Poverty |
| Natives/Alaskans | 0.0 /100 | #333 | Tragic 16.9% |
| Cheyenne | 0.0 /100 | #334 | Tragic 17.6% |
| Apache | 0.0 /100 | #335 | Tragic 17.7% |
| Pueblo | 0.0 /100 | #336 | Tragic 18.5% |
| Sioux | 0.0 /100 | #337 | Tragic 18.7% |
| Crow | 0.0 /100 | #338 | Tragic 19.1% |
| Yuman | 0.0 /100 | #339 | Tragic 19.5% |
| Immigrants | Yemen | 0.0 /100 | #340 | Tragic 20.1% |
| Lumbee | 0.0 /100 | #341 | Tragic 20.2% |
| Pima | 0.0 /100 | #342 | Tragic 20.4% |
| Yup'ik | 0.0 /100 | #343 | Tragic 20.4% |
| Hopi | 0.0 /100 | #344 | Tragic 20.8% |
| Puerto Ricans | 0.0 /100 | #345 | Tragic 22.0% |
| Navajo | 0.0 /100 | #346 | Tragic 22.3% |
| Tohono O'odham | 0.0 /100 | #347 | Tragic 22.9% |
Demographics Similar to Croatians by Male Poverty
In terms of male poverty, the demographic groups most similar to Croatians are Italian (9.6%, a difference of 0.010%), Swedish (9.6%, a difference of 0.090%), Eastern European (9.6%, a difference of 0.23%), Immigrants from Scotland (9.6%, a difference of 0.25%), and Latvian (9.6%, a difference of 0.51%).
| Demographics | Rating | Rank | Male Poverty |
| Bhutanese | 99.8 /100 | #15 | Exceptional 9.5% |
| Luxembourgers | 99.8 /100 | #16 | Exceptional 9.5% |
| Norwegians | 99.8 /100 | #17 | Exceptional 9.5% |
| Lithuanians | 99.8 /100 | #18 | Exceptional 9.5% |
| Immigrants | Hong Kong | 99.7 /100 | #19 | Exceptional 9.6% |
| Latvians | 99.7 /100 | #20 | Exceptional 9.6% |
| Immigrants | Scotland | 99.7 /100 | #21 | Exceptional 9.6% |
| Croatians | 99.7 /100 | #22 | Exceptional 9.6% |
| Italians | 99.7 /100 | #23 | Exceptional 9.6% |
| Swedes | 99.7 /100 | #24 | Exceptional 9.6% |
| Eastern Europeans | 99.6 /100 | #25 | Exceptional 9.6% |
| Burmese | 99.6 /100 | #26 | Exceptional 9.7% |
| Danes | 99.6 /100 | #27 | Exceptional 9.7% |
| Immigrants | Korea | 99.6 /100 | #28 | Exceptional 9.7% |
| Greeks | 99.6 /100 | #29 | Exceptional 9.7% |