Immigrants from Oceania vs Hmong Male Poverty
COMPARE
Immigrants from Oceania
Hmong
Male Poverty
Male Poverty Comparison
Immigrants from Oceania
Hmong
11.2%
MALE POVERTY
50.0/ 100
METRIC RATING
174th/ 347
METRIC RANK
11.6%
MALE POVERTY
15.8/ 100
METRIC RATING
196th/ 347
METRIC RANK
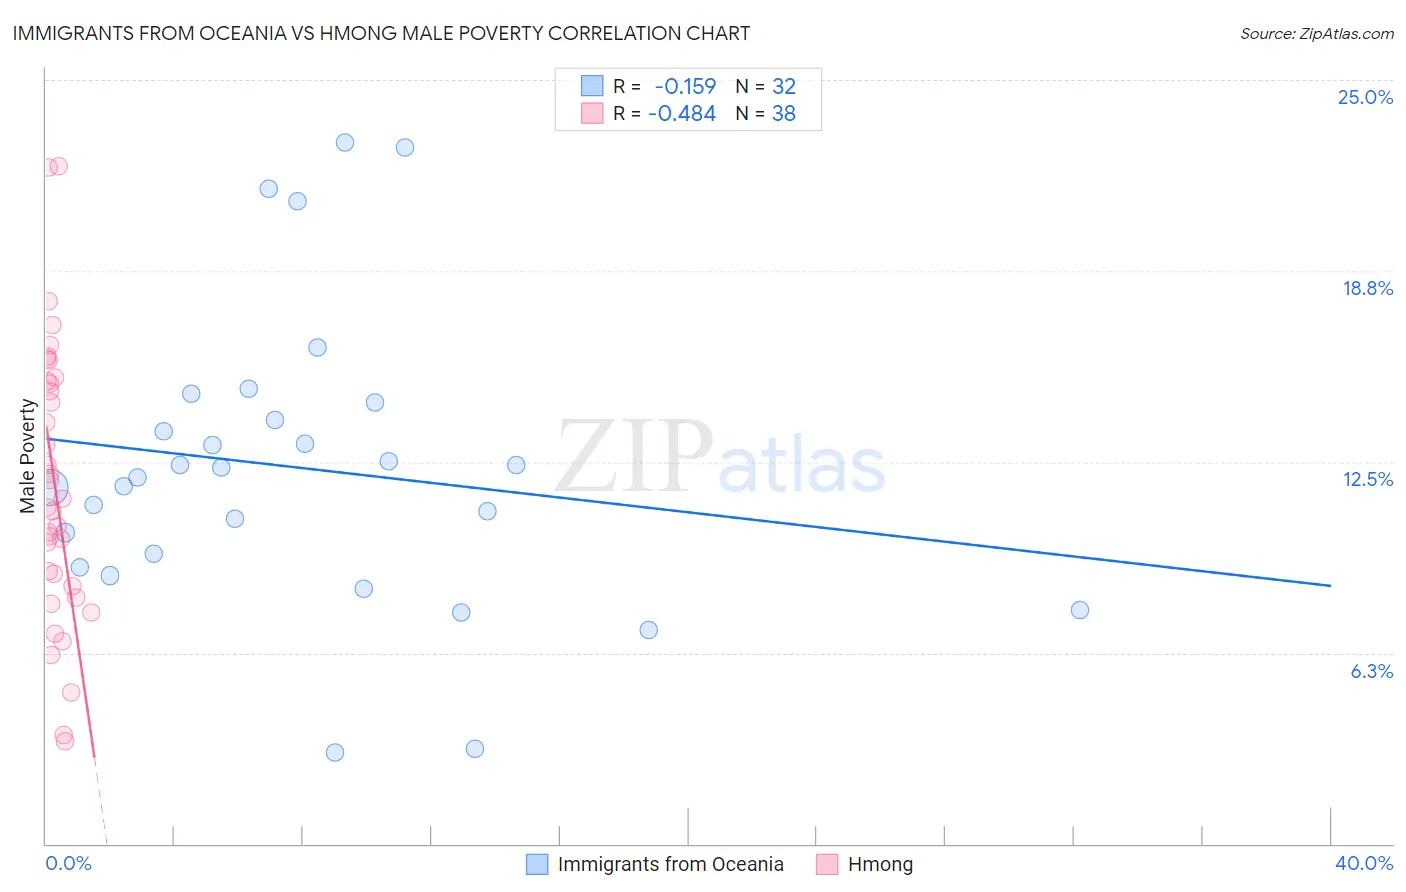
Immigrants from Oceania vs Hmong Male Poverty Correlation Chart
The statistical analysis conducted on geographies consisting of 305,340,172 people shows a poor negative correlation between the proportion of Immigrants from Oceania and poverty level among males in the United States with a correlation coefficient (R) of -0.159 and weighted average of 11.2%. Similarly, the statistical analysis conducted on geographies consisting of 24,672,093 people shows a moderate negative correlation between the proportion of Hmong and poverty level among males in the United States with a correlation coefficient (R) of -0.484 and weighted average of 11.6%, a difference of 4.1%.
Male Poverty Correlation Summary
| Measurement | Immigrants from Oceania | Hmong |
| Minimum | 3.0% | 3.4% |
| Maximum | 23.0% | 22.2% |
| Range | 20.0% | 18.8% |
| Mean | 12.3% | 11.7% |
| Median | 12.1% | 11.1% |
| Interquartile 25% (IQ1) | 9.3% | 8.4% |
| Interquartile 75% (IQ3) | 14.2% | 15.1% |
| Interquartile Range (IQR) | 4.9% | 6.7% |
| Standard Deviation (Sample) | 4.8% | 4.5% |
| Standard Deviation (Population) | 4.8% | 4.5% |
Similar Demographics by Male Poverty
Demographics Similar to Immigrants from Oceania by Male Poverty
In terms of male poverty, the demographic groups most similar to Immigrants from Oceania are Pennsylvania German (11.2%, a difference of 0.040%), Immigrants from Ethiopia (11.2%, a difference of 0.070%), Uruguayan (11.2%, a difference of 0.10%), Celtic (11.2%, a difference of 0.25%), and South American (11.1%, a difference of 0.37%).
| Demographics | Rating | Rank | Male Poverty |
| Hungarians | 55.1 /100 | #167 | Average 11.1% |
| Immigrants | Portugal | 54.9 /100 | #168 | Average 11.1% |
| Immigrants | Colombia | 54.2 /100 | #169 | Average 11.1% |
| South Americans | 53.8 /100 | #170 | Average 11.1% |
| Uruguayans | 51.0 /100 | #171 | Average 11.2% |
| Immigrants | Ethiopia | 50.7 /100 | #172 | Average 11.2% |
| Pennsylvania Germans | 50.5 /100 | #173 | Average 11.2% |
| Immigrants | Oceania | 50.0 /100 | #174 | Average 11.2% |
| Celtics | 47.5 /100 | #175 | Average 11.2% |
| Immigrants | Fiji | 46.0 /100 | #176 | Average 11.2% |
| Lebanese | 45.6 /100 | #177 | Average 11.2% |
| Immigrants | Cameroon | 44.5 /100 | #178 | Average 11.2% |
| Immigrants | Syria | 40.3 /100 | #179 | Average 11.3% |
| Immigrants | Morocco | 40.1 /100 | #180 | Average 11.3% |
| Immigrants | Costa Rica | 39.5 /100 | #181 | Fair 11.3% |
Demographics Similar to Hmong by Male Poverty
In terms of male poverty, the demographic groups most similar to Hmong are Arab (11.6%, a difference of 0.010%), Immigrants from Kenya (11.6%, a difference of 0.050%), Delaware (11.7%, a difference of 0.060%), Iraqi (11.7%, a difference of 0.20%), and Immigrants from Kuwait (11.6%, a difference of 0.27%).
| Demographics | Rating | Rank | Male Poverty |
| Hawaiians | 28.3 /100 | #189 | Fair 11.4% |
| Israelis | 26.1 /100 | #190 | Fair 11.5% |
| South American Indians | 22.8 /100 | #191 | Fair 11.5% |
| Immigrants | Uruguay | 19.1 /100 | #192 | Poor 11.6% |
| Immigrants | Kuwait | 17.3 /100 | #193 | Poor 11.6% |
| Immigrants | Kenya | 16.1 /100 | #194 | Poor 11.6% |
| Arabs | 15.8 /100 | #195 | Poor 11.6% |
| Hmong | 15.8 /100 | #196 | Poor 11.6% |
| Delaware | 15.4 /100 | #197 | Poor 11.7% |
| Iraqis | 14.7 /100 | #198 | Poor 11.7% |
| Spanish | 14.1 /100 | #199 | Poor 11.7% |
| Immigrants | Lebanon | 13.6 /100 | #200 | Poor 11.7% |
| Spaniards | 13.5 /100 | #201 | Poor 11.7% |
| Aleuts | 10.4 /100 | #202 | Poor 11.8% |
| Immigrants | Western Asia | 9.8 /100 | #203 | Tragic 11.8% |