Liberian vs Polish Single Mother Poverty
COMPARE
Liberian
Polish
Single Mother Poverty
Single Mother Poverty Comparison
Liberians
Poles
29.9%
SINGLE MOTHER POVERTY
11.7/ 100
METRIC RATING
214th/ 347
METRIC RANK
28.4%
SINGLE MOTHER POVERTY
90.8/ 100
METRIC RATING
127th/ 347
METRIC RANK
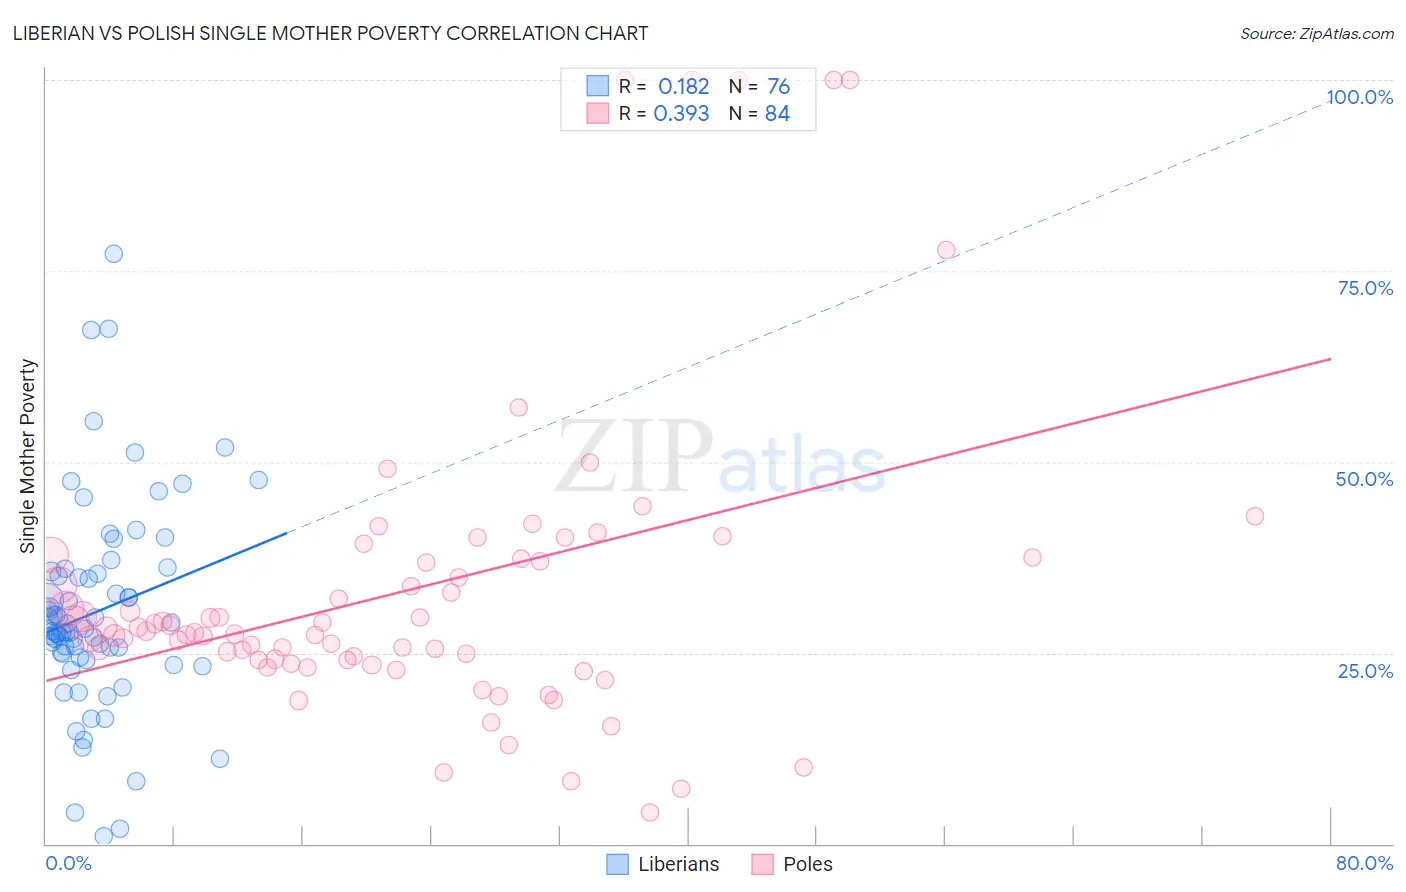
Liberian vs Polish Single Mother Poverty Correlation Chart
The statistical analysis conducted on geographies consisting of 117,524,642 people shows a poor positive correlation between the proportion of Liberians and poverty level among single mothers in the United States with a correlation coefficient (R) of 0.182 and weighted average of 29.9%. Similarly, the statistical analysis conducted on geographies consisting of 533,048,223 people shows a mild positive correlation between the proportion of Poles and poverty level among single mothers in the United States with a correlation coefficient (R) of 0.393 and weighted average of 28.4%, a difference of 5.3%.
Single Mother Poverty Correlation Summary
| Measurement | Liberian | Polish |
| Minimum | 1.1% | 4.1% |
| Maximum | 77.3% | 100.0% |
| Range | 76.3% | 95.9% |
| Mean | 30.4% | 33.1% |
| Median | 28.0% | 27.7% |
| Interquartile 25% (IQ1) | 24.7% | 24.1% |
| Interquartile 75% (IQ3) | 35.5% | 37.2% |
| Interquartile Range (IQR) | 10.8% | 13.1% |
| Standard Deviation (Sample) | 13.6% | 20.1% |
| Standard Deviation (Population) | 13.5% | 20.0% |
Similar Demographics by Single Mother Poverty
Demographics Similar to Liberians by Single Mother Poverty
In terms of single mother poverty, the demographic groups most similar to Liberians are Jamaican (29.9%, a difference of 0.0%), Immigrants from Western Africa (29.9%, a difference of 0.020%), Immigrants from Thailand (29.9%, a difference of 0.030%), Immigrants from Ghana (29.9%, a difference of 0.050%), and Nicaraguan (29.8%, a difference of 0.080%).
| Demographics | Rating | Rank | Single Mother Poverty |
| Immigrants | Panama | 15.5 /100 | #207 | Poor 29.8% |
| Immigrants | Guyana | 14.7 /100 | #208 | Poor 29.8% |
| Irish | 13.9 /100 | #209 | Poor 29.8% |
| Haitians | 13.3 /100 | #210 | Poor 29.8% |
| Guyanese | 12.8 /100 | #211 | Poor 29.8% |
| Nicaraguans | 12.4 /100 | #212 | Poor 29.8% |
| Immigrants | Thailand | 12.0 /100 | #213 | Poor 29.9% |
| Liberians | 11.7 /100 | #214 | Poor 29.9% |
| Jamaicans | 11.7 /100 | #215 | Poor 29.9% |
| Immigrants | Western Africa | 11.5 /100 | #216 | Poor 29.9% |
| Immigrants | Ghana | 11.3 /100 | #217 | Poor 29.9% |
| Hungarians | 10.3 /100 | #218 | Poor 29.9% |
| Finns | 9.3 /100 | #219 | Tragic 30.0% |
| Germans | 8.8 /100 | #220 | Tragic 30.0% |
| Immigrants | Eritrea | 7.7 /100 | #221 | Tragic 30.0% |
Demographics Similar to Poles by Single Mother Poverty
In terms of single mother poverty, the demographic groups most similar to Poles are Immigrants from Chile (28.4%, a difference of 0.010%), Kenyan (28.4%, a difference of 0.020%), Immigrants from England (28.4%, a difference of 0.030%), South American (28.4%, a difference of 0.060%), and Norwegian (28.4%, a difference of 0.060%).
| Demographics | Rating | Rank | Single Mother Poverty |
| Cypriots | 92.3 /100 | #120 | Exceptional 28.3% |
| Immigrants | Afghanistan | 92.1 /100 | #121 | Exceptional 28.3% |
| Colombians | 91.8 /100 | #122 | Exceptional 28.3% |
| Uruguayans | 91.7 /100 | #123 | Exceptional 28.3% |
| Immigrants | Switzerland | 91.7 /100 | #124 | Exceptional 28.3% |
| Kenyans | 90.9 /100 | #125 | Exceptional 28.4% |
| Immigrants | Chile | 90.8 /100 | #126 | Exceptional 28.4% |
| Poles | 90.8 /100 | #127 | Exceptional 28.4% |
| Immigrants | England | 90.5 /100 | #128 | Exceptional 28.4% |
| South Americans | 90.4 /100 | #129 | Exceptional 28.4% |
| Norwegians | 90.4 /100 | #130 | Exceptional 28.4% |
| Immigrants | Austria | 90.3 /100 | #131 | Exceptional 28.4% |
| Immigrants | Morocco | 89.5 /100 | #132 | Excellent 28.4% |
| Swedes | 89.4 /100 | #133 | Excellent 28.4% |
| Immigrants | Southern Europe | 89.2 /100 | #134 | Excellent 28.4% |